Albertsons 2016 Annual Report Download - page 40
Download and view the complete annual report
Please find page 40 of the 2016 Albertsons annual report below. You can navigate through the pages in the report by either clicking on the pages listed below, or by using the keyword search tool below to find specific information within the annual report.-
 1
1 -
2
-
3
-
4
-
5
-
6
-
7
-
8
-
9
-
10
-
11
-
12
-
13
-
14
-
15
-
16
-
17
-
18
-
19
-
20
-
21
-
22
-
23
-
24
-
25
-
26
-
27
-
28
-
29
-
 30
30 -
 31
31 -
 32
32 -
 33
33 -
 34
34 -
 35
35 -
 36
36 -
 37
37 -
 38
38 -
 39
39 -
 40
40 -
 41
41 -
 42
42 -
 43
43 -
 44
44 -
 45
45 -
 46
46 -
 47
47 -
 48
48 -
 49
49 -
 50
50 -
51
-
52
-
53
-
54
-
55
-
56
-
57
-
58
-
59
-
60
-
61
-
62
-
63
-
64
-
65
-
66
-
67
-
68
-
69
-
70
-
71
-
72
-
73
-
74
-
75
-
76
-
77
-
78
-
79
-
80
-
81
-
82
-
83
-
84
-
85
-
86
-
87
-
88
-
89
-
90
-
91
-
92
-
93
-
94
-
95
-
96
-
97
-
98
-
99
-
100
-
101
-
102
-
103
-
104
-
105
-
106
-
107
-
108
-
109
-
110
-
111
-
112
-
113
-
114
-
115
-
116
-
117
-
118
-
119
-
120
-
121
-
122
-
123
-
124
-
125
 |
 |
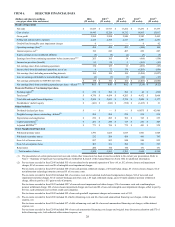
38
Save-A-Lot gross profit was $689 or 14.9 percent of Save-A-Lot net sales for fiscal 2015, compared with $654 or 15.4 percent for
fiscal 2014. Save-A-Lot gross profit increased $59 from higher sales. The 50 basis point decrease in Save-A-Lot gross profit rate
is primarily due to $15 of higher advertising costs and $12 of incremental investments to lower prices to customers and higher
shrink.
Retail gross profit was $1,317 or 27.0 percent of Retail net sales for fiscal 2015, compared with $1,261 or 27.1 percent for fiscal
2014. Retail gross profit increased $62 from higher sales. The 10 basis point decline in Retail gross profit rate is primarily due to
an $11 higher LIFO charge and $10 of higher incremental investments to lower prices to customers and shrink, offset in part by
$7 of lower employee-related costs.
Selling and Administrative Expenses
Selling and administrative expenses for fiscal 2015 were $2,164 compared with $2,117 for fiscal 2014, an increase of $47 or 2.2
percent. Selling and administrative expenses for fiscal 2015 include net charges and costs of $75, comprised of non-cash pension
settlement charges of $64, a benefit plan charge of $5, store closure charges of $3, information technology intrusion costs, net of
insurance recoverable, of $2, and severance costs of $1. Selling and administrative expenses for fiscal 2014 included net charges
and costs of $58, comprised of severance costs and accelerated stock-based compensation charges of $46, asset impairment and
other charges of $16, contract breakage and other costs of $6 and a legal settlement charge of $5, offset in part by a gain on sale of
property of $15. When adjusted for these items, the remaining $30 increase in Selling and administrative expenses is primarily
due to $102 of higher expenses from increased sales volume and $8 of higher employee-related costs, offset in part by $43 of
lower net periodic pension expense and $42 of reduced depreciation and amortization expense and occupancy costs.
Selling and administrative expenses for fiscal 2015 were 12.1 percent of Net sales, compared with 12.3 percent of Net sales for
fiscal 2014. Selling and administrative expenses as a percent of Net sales for fiscal 2015 include 40 basis points from the net
charges and costs of $75 described above. Selling and administrative expenses as a percent of Net sales for fiscal 2014 included
30 basis points from net charges and costs of $58 described above. The remaining 30 basis points net reduction in Selling and
administrative expenses as a percent of Net sales is primarily due to lower net periodic pension expense and reduced depreciation
and amortization expense and occupancy costs, offset in part by higher employee-related costs.
Operating Earnings
Operating earnings for fiscal 2015 were $424, compared with $423 for fiscal 2014, an increase of $1 or 0.2 percent. Operating
earnings for fiscal 2015 included net charges and costs of $75, comprised of the non-cash pension settlement charges, a benefit
plan charge, store closure charges, information technology intrusion costs, net of insurance recoverable, and severance costs as
discussed above. Operating earnings for fiscal 2014 included net charges and costs of $61, comprised of severance costs and
accelerated stock-based compensation charges, asset impairment and other charges, contract breakage and other costs, a legal
settlement charge and a multi-employer pension plan withdrawal charge, offset in part by a gain on sale of property as discussed
above. The remaining $15 increase in Operating earnings is primarily due to $43 of lower net periodic pension expense, $42 of
reduced depreciation and amortization expense and occupancy costs, $24 of higher earnings from increased sales and $12 of
lower logistics costs, offset in part by $46 of lower TSA fees primarily due to the one-year transition fee recognized in fiscal
2014, $33 of incremental investments to lower prices to customers, higher shrink, stronger private brands pricing support and
other margin investments, an $18 higher LIFO charge and $12 of higher advertising costs.
Wholesale operating earnings for fiscal 2015 were $243, or 3.0 percent of Wholesale net sales, compared with $235, or 2.9
percent for fiscal 2014. Wholesale operating earnings for fiscal 2015 included $1 of severance costs. Wholesale operating
earnings for fiscal 2014 included net charges and costs of $8, comprised of severance costs and accelerated stock-based
compensation costs of $17, a multi-employer pension plan withdrawal charge of $3, asset impairment and other charges of $2 and
contract breakage costs of $1, offset in part by a gain on sale of property of $15. The remaining $1 increase in Wholesale
operating earnings is primarily due to lower logistics costs and fees received from early supply agreement termination, higher
earnings from increased sales and lower depreciation expense, offset in part by lower margins from stronger private brands
pricing support and other margin investments, higher employee-related costs and a higher LIFO charge.
Save-A-Lot operating earnings for fiscal 2015 were $153, or 3.3 percent of Save-A-Lot net sales, compared with $167, or 3.9
percent for fiscal 2014. Save-A-Lot operating earnings for fiscal 2015 included store closure charges of $3. Save-A-Lot operating
earnings for fiscal 2014 included charges and costs of $10, comprised of a legal settlement charge of $5, asset impairment and
other charges of $3 and severance costs of $2. The remaining $21 decrease in Save-A-Lot’s operating earnings is primarily due to
$15 of higher advertising costs, $12 of higher shrink and incremental investments to lower prices to customers and $12 of higher
employee-related and occupancy costs, offset in part by $16 of higher earnings from increased sales.
Retail operating earnings for fiscal 2015 were $122, or 2.5 percent of Retail net sales, compared with $77, or 1.7 percent for fiscal
2014. Retail operating earnings for fiscal 2014 included charges and costs of $19, comprised of asset impairment and other