Albertsons 2016 Annual Report Download - page 35
Download and view the complete annual report
Please find page 35 of the 2016 Albertsons annual report below. You can navigate through the pages in the report by either clicking on the pages listed below, or by using the keyword search tool below to find specific information within the annual report.-
 1
1 -
2
-
3
-
4
-
5
-
6
-
7
-
8
-
9
-
10
-
11
-
12
-
13
-
14
-
15
-
16
-
17
-
18
-
19
-
20
-
21
-
22
-
23
-
24
-
 25
25 -
 26
26 -
 27
27 -
 28
28 -
 29
29 -
 30
30 -
 31
31 -
 32
32 -
 33
33 -
 34
34 -
 35
35 -
 36
36 -
 37
37 -
 38
38 -
 39
39 -
 40
40 -
 41
41 -
 42
42 -
 43
43 -
 44
44 -
 45
45 -
46
-
47
-
48
-
49
-
50
-
51
-
52
-
53
-
54
-
55
-
56
-
57
-
58
-
59
-
60
-
61
-
62
-
63
-
64
-
65
-
66
-
67
-
68
-
69
-
70
-
71
-
72
-
73
-
74
-
75
-
76
-
77
-
78
-
79
-
80
-
81
-
82
-
83
-
84
-
85
-
86
-
87
-
88
-
89
-
90
-
91
-
92
-
93
-
94
-
95
-
96
-
97
-
98
-
99
-
100
-
101
-
102
-
103
-
104
-
105
-
106
-
107
-
108
-
109
-
110
-
111
-
112
-
113
-
114
-
115
-
116
-
117
-
118
-
119
-
120
-
121
-
122
-
123
-
124
-
125
 |
 |

33
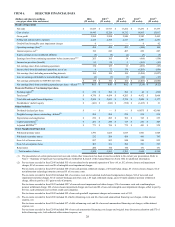
RESULTS OF OPERATIONS
Consolidated results of operations for fiscal 2016, 2015 and 2014 are as follows:
Fiscal Years Ended
February 27, 2016
(52 weeks) February 28, 2015
(53 weeks) February 22, 2014
(52 weeks)
Net sales $ 17,529 100.0% $ 17,917 100.0% $ 17,252 100.0%
Cost of sales 14,945 85.3 15,329 85.6 14,712 85.3
Gross profit 2,584 14.7 2,588 14.4 2,540 14.7
Selling and administrative expenses 2,124 12.1 2,164 12.1 2,117 12.3
Intangible asset impairment charge 6 — — — — —
Operating earnings 454 2.6 424 2.4 423 2.5
Interest expense, net 196 1.1 243 1.4 407 2.4
Equity in earnings of unconsolidated affiliates (5) — (4) — (2) —
Earnings from continuing operations before income taxes 263 1.5 185 1.0 18 0.1
Income tax provision 85 0.5 58 0.3 5 —
Net earnings from continuing operations 178 1.0 127 0.7 13 0.1
Income from discontinued operations, net of tax 8 — 72 0.4 176 1.0
Net earnings including noncontrolling interests 186 1.1 199 1.1 189 1.1
Less net earnings attributable to noncontrolling interests (8) — (7) — (7) —
Net earnings attributable to SUPERVALU INC. $ 178 1.0% $ 192 1.1% $ 182 1.1%
Basic net earnings per share attributable to SUPERVALU INC.:
Continuing operations $ 0.64 $ 0.46 $ 0.02
Discontinued operations $ 0.03 $ 0.28 $ 0.69
Basic net earnings per share $ 0.68 $ 0.74 $ 0.71
Diluted net earnings per share attributable to SUPERVALU INC.:
Continuing operations $ 0.63 $ 0.45 $ 0.02
Discontinued operations $ 0.03 $ 0.27 $ 0.68
Diluted net earnings per share $ 0.66 $ 0.73 $ 0.70
The following table summarizes identical store sales variances in percentages compared to the prior fiscal year:
Fiscal Years Ended
February 27,
2016
(52 weeks)
February 28,
2015
(53 weeks)(6)
Save-A-Lot Network:
Identical store sales percent variance(1) (1.4)% 5.8 %
Corporate Save-A-Lot Stores:
Identical store sales percent variance(2) 0.6 % 7.6 %
Average basket percent variance(3) 1.3 % 2.1 %
Customer count percent variance(4) (0.7)% 5.4 %
Retail:
Identical store sales percent variance(5) (2.5)% 1.0 %
Average basket percent variance(3) 0.7 % (1.4)%
Customer count percent variance(4) (3.2)% 2.4 %
(1) Save-A-Lot network identical store sales are defined as the sales attributable to Company-operated stores and sales to licensee stores operating for four
full quarters, including store expansions and excluding planned store dispositions.
(2) Corporate stores identical store sales are defined as the sales attributable to Company-operated stores operating for four full quarters, including store
expansions and excluding planned store dispositions.
(3) Average basket is defined as the average purchases by the Company's customers per transaction within its corporate retail stores operating for four full
quarters, including store expansions and excluding fuel and planned store dispositions.