Albertsons 2016 Annual Report Download - page 90
Download and view the complete annual report
Please find page 90 of the 2016 Albertsons annual report below. You can navigate through the pages in the report by either clicking on the pages listed below, or by using the keyword search tool below to find specific information within the annual report.-
 1
1 -
2
-
3
-
4
-
5
-
6
-
7
-
8
-
9
-
10
-
11
-
12
-
13
-
14
-
15
-
16
-
17
-
18
-
19
-
20
-
21
-
22
-
23
-
24
-
25
-
26
-
27
-
28
-
29
-
30
-
31
-
32
-
33
-
34
-
35
-
36
-
37
-
38
-
39
-
40
-
41
-
42
-
43
-
44
-
45
-
46
-
47
-
48
-
49
-
50
-
51
-
52
-
53
-
54
-
55
-
56
-
57
-
58
-
59
-
60
-
61
-
62
-
63
-
64
-
65
-
66
-
67
-
68
-
69
-
70
-
71
-
72
-
73
-
74
-
75
-
76
-
77
-
78
-
79
-
 80
80 -
 81
81 -
 82
82 -
 83
83 -
 84
84 -
 85
85 -
 86
86 -
 87
87 -
 88
88 -
 89
89 -
 90
90 -
 91
91 -
 92
92 -
 93
93 -
 94
94 -
 95
95 -
 96
96 -
 97
97 -
 98
98 -
 99
99 -
 100
100 -
101
-
102
-
103
-
104
-
105
-
106
-
107
-
108
-
109
-
110
-
111
-
112
-
113
-
114
-
115
-
116
-
117
-
118
-
119
-
120
-
121
-
122
-
123
-
124
-
125
 |
 |

88
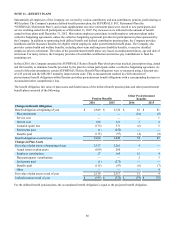
Assumptions
Weighted average assumptions used to determine benefit obligations and net periodic benefit cost consisted of the following:
2016 2015 2014
Benefit obligation assumptions:
Discount rate 4.16 – 3.95% 3.80% 4.65%
Rate of compensation increase —% —% —%
Net periodic benefit cost assumptions:(1)
Discount rate 3.80% 4.65 – 4.10% 4.25%
Rate of compensation increase —% —% 2.00%
Expected return on plan assets(2) 6.50% 7.00 – 6.50% 7.00%
(1) For fiscal 2016 and prior, net periodic benefit cost is measured using weighted average assumptions as of the beginning of each year.
(2) Expected return on plan assets is estimated by utilizing forward-looking, long-term return, risk and correlation assumptions developed
and updated annually by the Company. These assumptions are weighted by the actual or target allocation to each underlying asset
class represented in the pension plan asset portfolio. The Company also assesses the expected long-term return on plan assets
assumption by comparison to long-term historical performance on an asset class to ensure the assumption is reasonable. Long-term
trends are also evaluated relative to market factors such as inflation, interest rates, and fiscal and monetary policies in order to assess
the capital market assumptions.
The Company reviews and selects the discount rate to be used in connection with measuring its pension and other
postretirement benefit obligations annually. In determining the discount rate, the Company uses the yield on corporate bonds
(rated AA or better) that coincides with the cash flows of the plans’ estimated benefit payouts. The model uses a yield curve
approach to discount each cash flow of the liability stream at an interest rate specifically applicable to the timing of each
respective cash flow. The model totals the present values of all cash flows and calculates the equivalent weighted average
discount rate by imputing the singular interest rate that equates the total present value with the stream of future cash flows. This
resulting weighted average discount rate is then used in evaluating the final discount rate to be used by the Company.
Effective for fiscal 2017, the Company adopted an alternative approach for determining the interest and service cost
components of net periodic benefit cost for defined benefit pension and other postretirement benefit plans, the "full yield curve"
approach. Under this method, the discount rate assumption used in the interest and service cost components of net periodic
benefit cost was built through applying the specific spot rates along the yield curve used in the determination of the benefit
obligation described above, to the relevant projected future cash flows of the Company's pension and other postretirement
benefit plans. Prior to fiscal 2017, including for the current fiscal 2016 year being reported, the interest and service cost
components of pension expense were estimated using a single weighted-average discount rate derived from the yield curve used
to measure the projected benefit obligation at the beginning of the period.
The Company adopted the alternative approach to improve the correlation between projected benefit cash flows and the
corresponding yield curve spot rates and to provide a more precise measurement of interest and service costs. This change does
not affect the measurement of total benefit obligation. The Company has concluded that the application of the full yield curve
approach is a change in estimate and, accordingly, will recognize the effect prospectively beginning in fiscal 2017. The impact
of the change in estimate is an anticipated reduction of the interest and service cost components within net periodic benefit cost
in fiscal 2017 by approximately $22 for the defined benefit pension plans and less than $1 for postretirement benefit plans
compared to the prior year approach.
During fiscal 2016, the Retirement Plans Experience Committee of the Society of Actuaries ("RPEC") issued an update to
Mortality Improvement Scale MP-2014, which was released in October 2014, named MP-2015. This updated scale was created
using two additional years of historical data and the same RPEC 2014 model that was used to produce MP-2014. The Company
used MP-2015 to calculate its fiscal 2016 projected benefit obligation.
During fiscal 2015, the Company converted to the RP-2014 Aggregate mortality table for calculating the pension and other
postretirement obligations and the annual expense. This change increased the projected benefit obligation by $182 and the
accumulated postretirement benefit obligation by $6.
The Company calculates its expected return on plan assets by using the market related value of plan assets. The market related
value of plan assets is determined by adjusting the actual fair value of plan assets for unrecognized gains or losses on plan
assets. Unrecognized gains or losses represent the difference between actual returns and expected returns on plan assets for each
fiscal year and are recognized by the Company evenly over a three year period. Since the market related value of assets