Albertsons 2016 Annual Report Download - page 34
Download and view the complete annual report
Please find page 34 of the 2016 Albertsons annual report below. You can navigate through the pages in the report by either clicking on the pages listed below, or by using the keyword search tool below to find specific information within the annual report.-
 1
1 -
2
-
3
-
4
-
5
-
6
-
7
-
8
-
9
-
10
-
11
-
12
-
13
-
14
-
15
-
16
-
17
-
18
-
19
-
20
-
21
-
22
-
23
-
 24
24 -
 25
25 -
 26
26 -
 27
27 -
 28
28 -
 29
29 -
 30
30 -
 31
31 -
 32
32 -
 33
33 -
 34
34 -
 35
35 -
 36
36 -
 37
37 -
 38
38 -
 39
39 -
 40
40 -
 41
41 -
 42
42 -
 43
43 -
 44
44 -
45
-
46
-
47
-
48
-
49
-
50
-
51
-
52
-
53
-
54
-
55
-
56
-
57
-
58
-
59
-
60
-
61
-
62
-
63
-
64
-
65
-
66
-
67
-
68
-
69
-
70
-
71
-
72
-
73
-
74
-
75
-
76
-
77
-
78
-
79
-
80
-
81
-
82
-
83
-
84
-
85
-
86
-
87
-
88
-
89
-
90
-
91
-
92
-
93
-
94
-
95
-
96
-
97
-
98
-
99
-
100
-
101
-
102
-
103
-
104
-
105
-
106
-
107
-
108
-
109
-
110
-
111
-
112
-
113
-
114
-
115
-
116
-
117
-
118
-
119
-
120
-
121
-
122
-
123
-
124
-
125
 |
 |

32
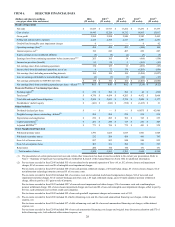
• Interest expense, net decreased $47 due to $33 of lower debt refinancing charges and costs and $14 of lower interest
expense primarily due to lower average outstanding debt balances.
• Net earnings from continuing operations increased $51 and Diluted earnings per share from continuing operations
increased $0.18 primarily due to the above items.
• Net cash provided by operating activities of continuing operations increased $88 primarily due to lower pension and other
postretirement benefit contributions, offset in part by lower cash generated from earnings after the impacts of net non-
cash expenses, such as net pension and postretirement benefit costs and depreciation, and when adjusted for payments for
debt refinancing costs included in earnings.
• Net cash used in investing activities of continuing operations increased $3 due to a $27 net increase in cash paid for
intangible and other assets driven by acquired intangible assets for Wholesale, and $22 of additional cash used in capital
expenditures reflecting new Save-A-Lot corporate and Retail stores, offset in part by $46 of lower cash used in business
acquisitions within Retail and Save-A-Lot.
• Net cash used in financing activities of continuing operations increased $101 primarily due to lower proceeds from the
issuance of long-term debt, offset in part by lower payments on long-term debt and lower payments for debt financing
costs.
Transition Services Agreements
The Company provides back-office administrative support services under the TSA with NAI and Albertson's LLC and the
Haggen TSA and is also providing services as needed to transition and wind down the TSA with NAI and Albertson's LLC. The
Company estimates that the complete transition and wind down of the TSA with NAI and Albertson's LLC could take
approximately two to three more years. In September 2015, Haggen filed voluntary petitions for reorganization under Chapter
11 of the U.S. Bankruptcy Code. Through the bankruptcy process, Haggen has now closed, sold or agreed to sell all 164 stores.
While the Company continues to provide services under the Haggen TSA, it believes it is likely that all such services under the
Haggen TSA will cease in the second quarter of fiscal 2017.
The Company is focused on executing its plans to mitigate the impact of the wind down of these TSAs on the Company's
results of operations, financial position and cash flows. For additional discussion of the TSAs, see “Risk Factors—The
Company’s relationships with NAI, Albertson’s LLC and Haggen are winding down, which could adversely impact the
Company’s results of operations” in Part I, Item 1A of this Annual Report on Form 10-K.
Impact of Inflation and Deflation
The Company monitors product cost inflation and deflation and evaluates whether to absorb cost increases or decreases, or pass
on pricing changes. The Company has experienced a mix of inflation and deflation across product categories within all three of
its business segments during fiscal 2016, with higher deflation levels in certain meat and dairy categories.
In fiscal 2016, when taking into account the overall mix of products, management estimates Save-A-Lot experienced cost
deflation in the mid-single digits, and Wholesale and Retail experienced approximately flat cost inflation. Save-A-Lot cost
deflation is primarily due to deflation within certain meat and dairy categories. The impact of deflation was greater at Save-A-
Lot, particularly its wholesale business, compared to Wholesale and Retail due to product mix and product sourcing on private-
label products. This deflationary environment in certain product categories in fiscal 2016 was more significant than
management’s expectations for fiscal 2016.
Changes in merchandising, customer buying habits and competitive pressures create inherent difficulties in measuring the
impact of inflation and deflation on Net sales and Gross profit.
Competitive Environment
The United States grocery channel is highly competitive and management expects operating results will continue to be
impacted by the effects of operating in a highly competitive and price-sensitive marketplace.