Yahoo 1998 Annual Report Download - page 60
Download and view the complete annual report
Please find page 60 of the 1998 Yahoo annual report below. You can navigate through the pages in the report by either clicking on the pages listed below, or by using the keyword search tool below to find specific information within the annual report.-
 1
1 -
2
-
3
-
4
-
5
-
6
-
7
-
8
-
9
-
10
-
11
-
12
-
13
-
14
-
15
-
16
-
17
-
18
-
19
-
20
-
21
-
22
-
23
-
24
-
25
-
26
-
27
-
28
-
29
-
30
-
31
-
32
-
33
-
34
-
35
-
36
-
37
-
38
-
39
-
40
-
41
-
42
-
43
-
44
-
45
-
46
-
47
-
48
-
49
-
 50
50 -
 51
51 -
 52
52 -
 53
53 -
 54
54 -
 55
55 -
 56
56 -
 57
57 -
 58
58 -
 59
59 -
 60
60 -
 61
61 -
 62
62 -
 63
63 -
 64
64 -
 65
65 -
 66
66
 |
 |

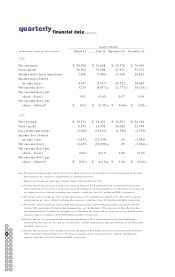
quarterlyfinancial data(unaudited)
Quarter Ended
(in thousands, except per share amounts) March 31 J une 30 September 30 December 31
1998
Net revenues $ 30,596 $ 41,688 $ 54,576 $ 76,410
Gross profit 26,302 35,904 47,051 67,271
Income (loss) from operations 2,658 (7,860) 13,146 20,824
Income (loss) before
income taxes 4,341 (5,917) 18,322 26,669
Net income (loss) 3,270 (8,977)(a) 12,771(b) 18,524(c)
Net income (loss) per
share – basic*0.02 (0.05) 0.07 0.09
Net income (loss) per
share – diluted*$ 0.02 $ (0.05)(a) $ 0.06(b) $ 0.08 (c)
1997
Net revenues $ 10,731 $ 14,432 $ 18,703 $ 26,584
Gross profit 8,835 11,908 16,028 22,794
Loss from operations (3,029) (23,641) (1,320) (2,792)
Income (loss) before
income taxes (1,435) (22,209) 65 (1,941)
Net income (loss) (1,435) (22,209)(d) 65 (1,941)(e)
Net income (loss) per
share – basic*(0.01) (0.13) 0.00 (0.01)
Net income (loss) per
share – diluted* $ (0.01) $ (0.13)(d) $ 0.00 $ (0.01)(e)
Note: The quarterly financial data for the quarters presented above has been restated to reflect the acquisition of Yoyodyne
Entertainment, Inc. which was accounted for as a pooling of interests.
* Reflects the two-for-one stock splits effective August 1998 and February 1999.
(a) Net loss and net loss per share include a non-recurring charge of $15.0 million incurred in connection with the J une
1998 acquisition of Viaweb Inc. and amortization of $0.7 million on related intangible assets. Pro forma net income and
net income per share - diluted, excluding these expenses, would have been $6.7 million and $0.03, respectively.
(b) Net income and net income per share include amortization of $2.1 million on intangible assets. Pro forma net income
and net income per share - diluted, excluding these expenses, would have been $14.9 million and $0.06, respectively.
(c) Net income and net income per share include non-recurring charges of $4.4 million incurred in connection with the
October 1998 acquisition of Yoyodyne Entertainment, Inc. and the December 1998 acquisition of HyperParallel, Inc.,
and amortization of $2.1 million on intangible assets. Pro forma net income and net income per share - diluted, exclud-
ing these expenses, would have been $25.0 million and $0.11, respectively.
(d) Net loss and net loss per share include a non-recurring charge of $21.2 million related to the Yahoo! Marketplace
restructuring. Pro forma net loss and net loss per share - diluted, excluding this expense, would have been $1.0 million
and $0.01, respectively.
(e) Net loss and net loss per share include a non-recurring charge of $3.9 million incurred in connection with the October
1997 acquisition of Four11 Corporation. Pro forma net income and net income per share - diluted, excluding this
expense, would have been $1.9 million and $0.01, respectively.
56 57
54
52
55
50
53
48
51
46
49
44
47
42
45
40
43
41
58 59
60 61
62