Yahoo 1998 Annual Report Download - page 29
Download and view the complete annual report
Please find page 29 of the 1998 Yahoo annual report below. You can navigate through the pages in the report by either clicking on the pages listed below, or by using the keyword search tool below to find specific information within the annual report.-
 1
1 -
2
-
3
-
4
-
5
-
6
-
7
-
8
-
9
-
10
-
11
-
12
-
13
-
14
-
15
-
16
-
17
-
18
-
 19
19 -
 20
20 -
 21
21 -
 22
22 -
 23
23 -
 24
24 -
 25
25 -
 26
26 -
 27
27 -
 28
28 -
 29
29 -
 30
30 -
 31
31 -
 32
32 -
 33
33 -
 34
34 -
 35
35 -
 36
36 -
 37
37 -
 38
38 -
 39
39 -
40
-
41
-
42
-
43
-
44
-
45
-
46
-
47
-
48
-
49
-
50
-
51
-
52
-
53
-
54
-
55
-
56
-
57
-
58
-
59
-
60
-
61
-
62
-
63
-
64
-
65
-
66
 |
 |

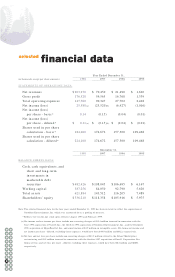
shareholder of the Company at December 31, 1998, accounted for approximately
5% and 4% of net revenues during the years ended December 31, 1998 and 1997,
respectively. Contracted prices on these orders are comparable to those given to
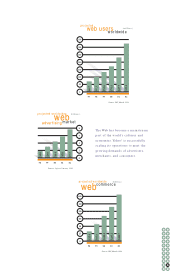
other major customers of the Company. International revenues have accounted for
less than 10% of net revenues during the years ended December 31, 1998, 1997, and
1996. Barter revenues also represented less than 10% of net revenues during those
periods. There can be no assurance that customers will continue to purchase
advertising on the Company’s Web pages, that advertisers will not make smaller
and shorter term purchases, or that market prices for Web-based advertising will
not decrease due to competitive or other factors. Additionally, while the Company
has experienced strong revenue growth during the last three years, management
does not believe that this level of revenue growth will be sustained in future periods.
Cost of Revenues. Cost of revenues consists of the expenses associated with the
production and usage of Yahoo! and the Company’s other online media properties.
These costs primarily consist of fees paid to third parties for content included on
the Company’s online media properties, Internet connection charges, amortization
of purchased technology, prize awards, equipment depreciation, and compensation.
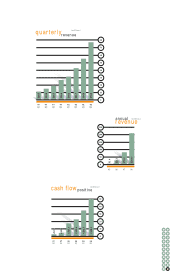
Cost of revenues were $26.7 million for the year ended December 31, 1998, or 13%
of net revenues, as compared to $10.9 million, or 15% of net revenues, and $4.7
million, or 22% of net revenues, for the years ended December 31, 1997 and 1996,
respectively. The absolute dollar increases in cost of revenues from year to year
are primarily attributable to an increase in the quantity of content available on the
Company’s online media properties, the increased usage of these properties, and
the amortization of technology purchased in the Viaweb acquisition. The Company
anticipates that its content and Internet connection expenses will increase with
the quantity and quality of content available on Yahoo! online media properties,
and increased usage of these properties. As measured in page views (defined as
electronic page displays), the Company delivered an average of approximately
167 million page views per day in December 1998 compared with an average of
approximately 65 million page views per day in December 1997 and an average of
approximately 20 million page views per day in December 1996. Yahoo! Japan, an 34 35
32
30
33
28
31
26
29
24
27
22
25
20
23
18
21
19
36 37
38 39