Yahoo 1998 Annual Report Download - page 33
Download and view the complete annual report
Please find page 33 of the 1998 Yahoo annual report below. You can navigate through the pages in the report by either clicking on the pages listed below, or by using the keyword search tool below to find specific information within the annual report.-
 1
1 -
2
-
3
-
4
-
5
-
6
-
7
-
8
-
9
-
10
-
11
-
12
-
13
-
14
-
15
-
16
-
17
-
18
-
19
-
20
-
21
-
22
-
 23
23 -
 24
24 -
 25
25 -
 26
26 -
 27
27 -
 28
28 -
 29
29 -
 30
30 -
 31
31 -
 32
32 -
 33
33 -
 34
34 -
 35
35 -
 36
36 -
 37
37 -
 38
38 -
 39
39 -
 40
40 -
 41
41 -
 42
42 -
 43
43 -
44
-
45
-
46
-
47
-
48
-
49
-
50
-
51
-
52
-
53
-
54
-
55
-
56
-
57
-
58
-
59
-
60
-
61
-
62
-
63
-
64
-
65
-
66
 |
 |

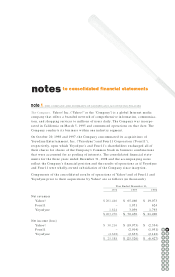
purchased technology and intangible assets acquired in the purchase of Viaweb,
the Company earned $49.9 million or $0.22 per share diluted for the year ended
December 31, 1998. Excluding the effect of the one-time, non-cash, pre-tax charge
of $21.2 million recorded for the restructuring of the Yahoo! Marketplace agree-
ments with the Visa Group and the one-time charge of $3.9 million recorded for
costs incurred for the acquisition of Four11, the Company’s net loss was $0.4
million or $0.00 per share diluted for the year ended December 31, 1997.
LIQUIDITY AND CAPITAL RESOURCES
Yahoo! invests excess cash predominantly in debt instruments that are highly
liquid, of high-quality investment grade, and predominantly have maturities of
less than one year with the intent to make such funds readily available for operating
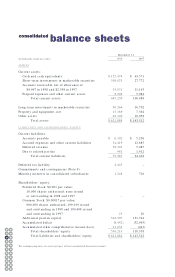
purposes. At December 31, 1998, the Company had cash and cash equivalents and
investments in marketable debt securities totaling $482.4 million compared to
$108.0 million at December 31, 1997. For the year ended December 31, 1998, cash
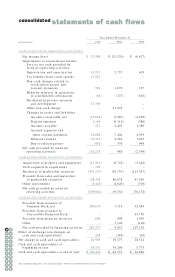
provided by operating activities was $110.3 million compared to cash provided by
operating activities of $0.5 million and cash used for operating activities of $2.4
million for the years ended December 31, 1997 and 1996, respectively.
For the year ended December 31, 1998, cash provided by operating activities of
$110.3 million was primarily due to earnings, before non-recurring charges of $17.3
million and depreciation and amortization of $10.2 million, increases in deferred
revenue (due to invoicing and cash receipts in excess of revenue) and accrued lia-
bilities, and tax benefits from stock option plans. The increase in deferred revenue
relates principally to overall significant growth in revenue and increases in advanced
payments on several new and relatively longer sponsorship agreements. For the
year ended December 31, 1997, cash provided by operating activities of $0.5 million
was primarily due to increases in accrued liabilities and deferred revenue, sub-
stantially offset by increases in prepaid expenses and other assets, which resulted
primarily from a $5.0 million one-time non-refundable license payment to Netscape
under the Netscape Guide by Yahoo! agreement and a $2.9 million payment to
Netscape under the international Netscape Net Search program agreement. For the
year ended December 31, 1996, cash used by operating activities was $2.4 million.
Cash used in investing activities was $329.9 million for the year ended December
31, 1998. Purchases (net of sales and maturities) of investments in marketable
securities and other assets during the period were $312.8 million and capital
expenditures totaled $11.9 million. Capital expenditures have generally been
comprised of purchases of computer hardware and software as well as leasehold
improvements related to leased facilities, and are expected to increase in future
periods. Cash provided by investing activities was $19.6 million for the year ended
December 31, 1997. Sales and maturities (net of purchases) of investments in
marketable securities during the period were $27.9 million and capital expendi-
tures totaled $6.7 million. Cash used in investing activities was $76.2 million for
the year ended December 31, 1996. Purchases (net of sales and maturities) of
investments in marketable securities and other assets during the period were $72.0
million and capital expenditures totaled $3.4 million.
34 35
32
30
33
28
31
26
29
24
27
22
25
20
23
18
21
19
36 37
38 39