Yahoo 1998 Annual Report Download - page 55
Download and view the complete annual report
Please find page 55 of the 1998 Yahoo annual report below. You can navigate through the pages in the report by either clicking on the pages listed below, or by using the keyword search tool below to find specific information within the annual report.-
 1
1 -
2
-
3
-
4
-
5
-
6
-
7
-
8
-
9
-
10
-
11
-
12
-
13
-
14
-
15
-
16
-
17
-
18
-
19
-
20
-
21
-
22
-
23
-
24
-
25
-
26
-
27
-
28
-
29
-
30
-
31
-
32
-
33
-
34
-
35
-
36
-
37
-
38
-
39
-
40
-
41
-
42
-
43
-
44
-
 45
45 -
 46
46 -
 47
47 -
 48
48 -
 49
49 -
 50
50 -
 51
51 -
 52
52 -
 53
53 -
 54
54 -
 55
55 -
 56
56 -
 57
57 -
 58
58 -
 59
59 -
 60
60 -
 61
61 -
 62
62 -
 63
63 -
 64
64 -
 65
65 -
66
 |
 |

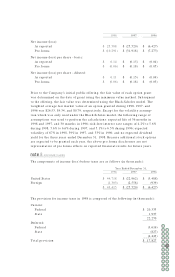
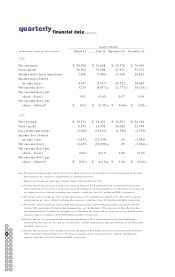
1998 1997 1996
Net income (loss):
As reported $ 25,588 $ (25,520) $ (6,427)
Pro forma $ (10,291) $ (31,918) $ (7,273)
Net income (loss) per share - basic:
As reported $ 0.14 $ (0.15) $ (0.04)
Pro forma $ (0.06) $ (0.18) $ (0.05)
Net income (loss) per share - diluted:
As reported $ 0.11 $ (0.15) $ (0.04)
Pro forma $ (0.06) $ (0.18) $ (0.05)
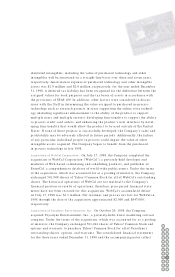
Prior to the Company’s initial public offering, the fair value of each option grant
was determined on the date of grant using the minimum value method. Subsequent
to the offering, the fair value was determined using the Black-Scholes model. The
weighted average fair market value of an option granted during 1998, 1997, and
1996 was $26.53, $4.34, and $0.79, respectively. Except for the volatility assump-
tion which was only used under the Black-Scholes model, the following range of
assumptions was used to perform the calculations: expected life of 36 months in
1998 and 1997, and 30 months in 1996; risk-free interest rate ranges of 4.2% to 5.6%
during 1998, 5.6% to 6.6% during 1997, and 5.1% to 6.5% during 1996; expected
volatility of 67% in 1998, 59% in 1997, and 53% in 1996; and no expected dividend
yield for the three years ended December 31, 1998. Because additional stock options
are expected to be granted each year, the above pro forma disclosures are not
representative of pro forma effects on reported financial results for future years.
INCOME TAXES
The components of income (loss) before taxes are as follows (in thousands):
Year Ended December 31,
1998 1997 1996
United States $ 44,718 $ (22,962) $ (5,488)
Foreign (1,303) (2,558) (939)
$ 43,415 $ (25,520) $ (6,427)
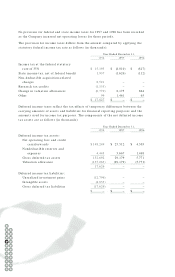
The provision for income taxes in 1998 is composed of the following (in thousands):
Current:
Federal $ 20,333
State 1,937
22,270
Deferred:
Federal (3,616)
State (827)
(4,443)
Total provision $ 17,827
note 8
56 57
54
52
55
50
53
48
51
46
49
44
47
42
45
40
43
41
58 59
60 61
62