Yahoo 1998 Annual Report Download - page 40
Download and view the complete annual report
Please find page 40 of the 1998 Yahoo annual report below. You can navigate through the pages in the report by either clicking on the pages listed below, or by using the keyword search tool below to find specific information within the annual report.
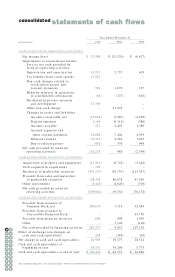
consolidated statements of cash flows
Year Ended December 31,
(in thousands) 1998 1997 1996
CASH FLOWS FROM OPERATING ACTIVITIES:
Net income (loss) $ 25,588 $ (25,520) $ (6,427)
Adjustments to reconcile net income
(loss) to net cash provided by
(used in) operating activities:
Depreciation and amortization 10,215 2,737 639
Tax benefits from stock options 17,827 ––
Non-cash charges related to
stock option grants and
warrant issuances 926 1,676 197
Minority interests in operations
of consolidated subsidiaries (68) (727) (540)
Purchased in-process research
and development 17,300 ––
Other non-cash charge –21,245 –
Changes in assets and liabilities:
Accounts receivable, net (13,616) (5,963) (4,269)
Prepaid expenses 2,144 (6,110) (386)
Accounts payable 515 2,425 1,386
Accrued expenses and
other current liabilities 16,688 7,404 4,393
Deferred revenue 33,210 2,983 1,665
Due to related parties (451) 330 948
Net cash provided by (used in)
operating activities 110,278 480 (2,394)
CASH FLOWS FROM INVESTING ACTIVITIES:
Acquisition of property and equipment (11,911) (6,722) (3,442)
Cash acquired in acquisitions 199 ––
Purchases of marketable securities (471,135) (58,753) (115,247)
Proceeds from sales and maturities
of marketable securities 158,350 86,678 43,240
Other investments (5,445) (1,649) (729)
Net cash provided by (used in)
investing activities (329,942) 19,554 (76,178)
CASH FLOWS FROM FINANCING ACTIVITIES:
Proceeds from issuance of
Common Stock, net 280,679 7,516 42,484
Proceeds from issuance of
Convertible Preferred Stock –– 63,750
Proceeds from minority investors 600 999 1,050
Other –1,106 (128)
Net cash provided by financing activities 281,279 9,621 107,156
Effect of exchange rate changes on
cash and cash equivalents 288 (380) (63)
Net change in cash and cash equivalents 61,903 29,275 28,521
Cash and cash equivalents at
beginning of year 63,571 34,296 5,775
Cash and cash equivalents at end of year $ 125,474 $ 63,571 $ 34,296
The accompanying notes are an integral part of these consolidated financial statements.
34 35
32
30
33
28
31
26
29
24
27
22
25
20
23
18
21
19
36 37
38 39


