Yahoo 1998 Annual Report Download - page 47
Download and view the complete annual report
Please find page 47 of the 1998 Yahoo annual report below. You can navigate through the pages in the report by either clicking on the pages listed below, or by using the keyword search tool below to find specific information within the annual report.-
 1
1 -
2
-
3
-
4
-
5
-
6
-
7
-
8
-
9
-
10
-
11
-
12
-
13
-
14
-
15
-
16
-
17
-
18
-
19
-
20
-
21
-
22
-
23
-
24
-
25
-
26
-
27
-
28
-
29
-
30
-
31
-
32
-
33
-
34
-
35
-
36
-
 37
37 -
 38
38 -
 39
39 -
 40
40 -
 41
41 -
 42
42 -
 43
43 -
 44
44 -
 45
45 -
 46
46 -
 47
47 -
 48
48 -
 49
49 -
 50
50 -
 51
51 -
 52
52 -
 53
53 -
 54
54 -
 55
55 -
 56
56 -
 57
57 -
58
-
59
-
60
-
61
-
62
-
63
-
64
-
65
-
66
 |
 |

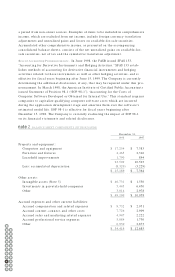
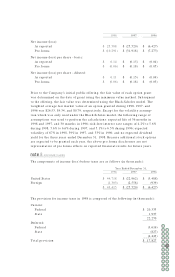
INVESTMENTS
At December 31, 1998, short and long-term investments in marketable securities
were classified as available-for-sale as follows (in thousands):
Gross Gross Gross Estimated
Amortized Unrealized Unrealized Fair
Costs Gains Losses Value
U.S. Government and agencies $ 331,757 $ 611 $ – $ 332,368
Municipal bonds 12,893 81 – 12,974
Corporate debt securities 8,584 26 – 8,610
Corporate equity securities 7,454 33,885 – 41,339
Other 3,020 – (20) 3,000
$ 363,708 $ 34,603 $ (20) $ 398,291
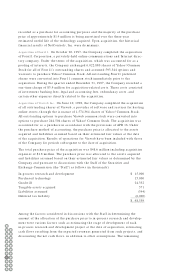
The contractual maturities of debt securities classified as available-for-sale as of
December 31, 1998 are as follows (in thousands):
Estimated
Fair Value
Due within one year $ 308,025
Due after one year through two years 48,927
$ 356,952
At December 31, 1997, short and long-term investments in marketable securities
were classified as available-for-sale and consisted of 81% corporate debt securities,
8% debt securities of the U.S. Government and its agencies, 4% municipal debt secu-
rities, and 7% foreign debt securities. At December 31, 1997, the fair value of the
investments approximated cost.
RELATED PARTY TRANSACTIONS
During 1998, 1997 and 1996, the Company recognized net revenues of approximately
$10.3 million, $3.1 million, and $2.4 million, respectively, on advertising contracts
and publication, development, and licensing arrangements with SOFTBANK and its
related companies (such as E*Trade Group, Inc., Kingston Technology Company,
and E-Loan, Inc.), a holder of approximately 30% of the Company’s Common Stock
at December 31, 1998. Prices on these contracts were comparable to those given to
other similar customers of the Company. Additionally, three SOFTBANK-related
companies provided Internet access and sales and marketing-related services for
fees of approximately $3.1 million, $3.2 million, and $2.3 million during 1998,
1997, and 1996, respectively. Sequoia Capital, a holder of approximately 3% of the
Company’s Common Stock at December 31, 1998, was also an investor in one of
these SOFTBANK-related companies.
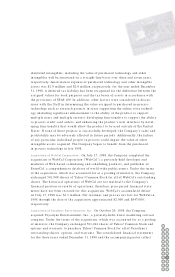
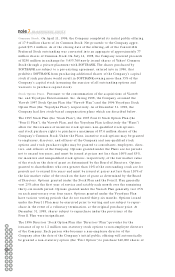
ACQUISITIONS
Acquisition of NetControls. On J uly 31, 1997, the Company entered into a stock
purchase agreement to acquire all of the outstanding capital stock of NetControls,
Inc. for 148,668 shares of the Company’s Common Stock. The acquisition was
note 3note 3
note 4note 4
note 5
56 57
54
52
55
50
53
48
51
46
49
44
47
42
45
40
43
41
58 59
60 61
62