Yahoo 1998 Annual Report Download - page 24
Download and view the complete annual report
Please find page 24 of the 1998 Yahoo annual report below. You can navigate through the pages in the report by either clicking on the pages listed below, or by using the keyword search tool below to find specific information within the annual report.-
 1
1 -
2
-
3
-
4
-
5
-
6
-
7
-
8
-
9
-
10
-
11
-
12
-
13
-
 14
14 -
 15
15 -
 16
16 -
 17
17 -
 18
18 -
 19
19 -
 20
20 -
 21
21 -
 22
22 -
 23
23 -
 24
24 -
 25
25 -
 26
26 -
 27
27 -
 28
28 -
 29
29 -
 30
30 -
 31
31 -
 32
32 -
 33
33 -
 34
34 -
35
-
36
-
37
-
38
-
39
-
40
-
41
-
42
-
43
-
44
-
45
-
46
-
47
-
48
-
49
-
50
-
51
-
52
-
53
-
54
-
55
-
56
-
57
-
58
-
59
-
60
-
61
-
62
-
63
-
64
-
65
-
66
 |
 |

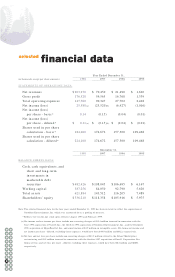
selected financial data
Year Ended December 31,
(in thousands, except per share amounts) 1998 1997 1996 1995
STATEMENTS OF OPERATIONS DATA:
Net revenues $ 203,270 $ 70,450 $ 21,490 $ 1,620
Gross profit 176,528 59,565 16,768 1,339
Total operating expenses 147,760 90,347 27,702 2,428
Net income (loss) 25,588(a) (25,520)(b) (6,427) (1,016)
Net income (loss)
per share - basic*0.14 (0.15) (0.04) (0.01)
Net income (loss)
per share - diluted *$ 0.11(a) $ (0.15)(b) $ (0.04) $ (0.01)
Shares used in per share
calculation - basic*184,060 174,672 157,300 109,468
Shares used in per share
calculation - diluted *224,100 174,672 157,300 109,468
December 31,
1998 1997 1996 1995
BALANCE SHEETS DATA:
Cash, cash equivalents, and
short and long-term
investments in
marketable debt
securities $ 482,426 $108,045 $ 106,695 $ 6,167
Working capital 387,256 84,050 92,790 5,620
Total assets 621,884 143,512 116,205 7,489
Shareholders’ equity $ 536,210 $118,358 $ 105,916 $ 5,975
Note: The selected financial data for the four years ended December 31, 1998 has been restated to reflect the acquisition of
Yoyodyne Entertainment, Inc. which was accounted for as a pooling of interests.
* Reflects the two-for-one stock splits effective August 1998 and February 1999.
(a) Net income and net income per share include non-recurring charges of $19.4 million incurred in connection with the
J une 1998 acquisition of Viaweb Inc., the October 1998 acquisition of Yoyodyne Entertainment, Inc., and the December
1998 acquisition of HyperParallel, Inc., and amortization of $4.9 million on intangible assets. Pro forma net income and
net income per share - diluted, excluding these expenses, would have been $49.9 million and $0.22, respectively.
(b) Net loss and net loss per share include non-recurring charges of $21.2 million related to the Yahoo! Marketplace
restructuring and $3.9 million incurred in connection with the October 1997 acquisition of Four11 Corporation. Pro
forma net loss and net loss per share - diluted, excluding these expenses, would have been $0.4 million and $0.00,
respectively.
34 35
32
30
33
28
31
26
29
24
27
22
25
20
23
18
21
19
36 37
38 39