Xcel Energy 2000 Annual Report Download - page 7
Download and view the complete annual report
Please find page 7 of the 2000 Xcel Energy annual report below. You can navigate through the pages in the report by either clicking on the pages listed below, or by using the keyword search tool below to find specific information within the annual report.
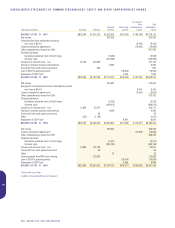
Accumulated
Other Total
Retained Shares Held Comprehensive Stockholders’
(Thousands of dollars) Par Value Premium Earnings by ESOP Income Equity
BALANCE AT DEC. 31, 1997 $802,245 $1,972,223 $2,023,925 $(10,533) $ (58,745) $4,729,115
Net income 624,330 624,330
Unrealized loss from marketable securities,
net of tax of $4,417 (6,416) (6,416)
Currency translation adjustments (16,089) (16,089)
Other comprehensive income for 1998 601,825
Dividends declared:
Cumulative preferred stock of Xcel Energy (5,548) (5,548)
Common stock (475,399) (475,399)
Issuances of common stock – net 23,150 223,985 247,135
Pooling of interests business combinations 6,065 6,065
Tax benefit from stock options exercised 850 850
Loan to ESOP to purchase shares*(15,000) (15,000)
Repayment of ESOP loan*7,030 7,030
BALANCE AT DEC. 31, 1998 $825,395 $2,197,058 $2,173,373 $(18,503) $ (81,250) $5,096,073
Net income 570,933 570,933
Recognition of unrealized loss from marketable securities,
net of tax of $4,417 6,416 6,416
Currency translation adjustments (3,587) (3,587)
Other comprehensive income for 1999 573,762
Dividends declared:
Cumulative preferred stock of Xcel Energy (5,292) (5,292)
Common stock (489,813) (489,813)
Issuances of common stock – net 12,930 92,247 105,177
Pooling of interests business combinations 4,599 4,599
Tax benefit from stock options exercised 58 58
Other (132) (1,109) (1,241)
Repayment of ESOP loan*6,897 6,897
BALANCE AT DEC. 31, 1999 $838,193 $2,288,254 $2,253,800 $(11,606) $ (78,421) $5,290,220
Net income 526,828 526,828
Currency translation adjustments (78,508) (78,508)
Other comprehensive income for 2000 448,320
Dividends declared:
Cumulative preferred stock of Xcel Energy (4,241) (4,241)
Common stock (492,183) (492,183)
Issuances of common stock – net 13,892 102,785 116,677
Tax benefit from stock options exercised 53 53
Other 16 16
Gain recognized from NRG stock offering 215,933 215,933
Loan to ESOP to purchase shares (20,000) (20,000)
Repayment of ESOP loan*6,989 6,989
BALANCE AT DEC. 31, 2000 $852,085 $2,607,025 $2,284,220 $(24,617) $(156,929) $5,561,784
*Did not affect cash flows
See Notes to Consolidated Financial Statements
36
XCEL ENERGY INC. AND SUBSIDIARIES
CONSOLIDATED STATEMENTS OF COMMON STOCKHOLDERS’ EQUITY AND OTHER COMPREHENSIVE INCOME

