Xcel Energy 2000 Annual Report Download - page 4
Download and view the complete annual report
Please find page 4 of the 2000 Xcel Energy annual report below. You can navigate through the pages in the report by either clicking on the pages listed below, or by using the keyword search tool below to find specific information within the annual report.-
 1
1 -
 2
2 -
 3
3 -
 4
4 -
 5
5 -
 6
6 -
 7
7 -
 8
8 -
 9
9 -
 10
10 -
 11
11 -
 12
12 -
 13
13 -
 14
14 -
 15
15 -
16
-
17
-
18
-
19
-
20
-
21
-
22
-
23
-
24
-
25
-
26
-
27
-
28
-
29
-
30
-
31
-
32
-
33
-
34
-
35
-
36
-
37
-
38
-
39
-
40
 |
 |

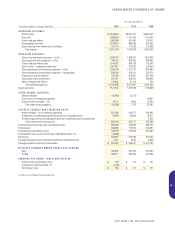
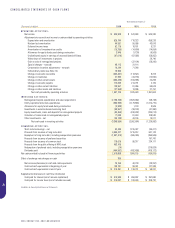
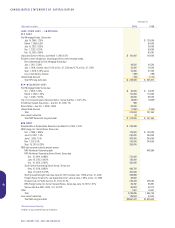
Year ended December 31
(Thousands of dollars, except per share data) 2000 1999 1998
OPERATING REVENUES:
Electric utility $ 5,679,925 $4,921,612 $4,984,232
Gas utility 1,468,880 1,141,429 1,110,004
Electric and gas trading 2,056,399 951,490 135,471
Nonregulated and other 2,203,878 688,888 382,603
Equity earnings from investments in affiliates 182,714 112,124 115,985
Total revenue 11,591,796 7,815,543 6,728,295
OPERATING EXPENSES:
Electric fuel and purchased power – utility 2,568,150 1,958,912 1,973,043
Cost of gas sold and transported – utility 948,145 683,455 659,493
Electric and gas trading costs 2,016,927 946,139 133,508
Cost of sales – nonregulated and other 1,047,617 323,262 203,958
Other operating and maintenance expenses – utility 1,398,708 1,327,797 1,354,980
Other operating and maintenance expenses – nonregulated 656,260 302,201 223,374
Depreciation and amortization 792,395 679,851 627,438
Taxes (other than income taxes) 351,412 360,916 356,045
Special charges (see Note 2) 241,042 31,114 790
Total operating expenses 10,020,656 6,613,647 5,532,629
Operating income 1,571,140 1,201,896 1,195,666
OTHER INCOME (EXPENSE):
Minority interest (40,489) (2,773)
Gain on sale of nonregulated projects 29,951
Interest income and other – net 16,107 4,560 22,390
Total other income (expense) (24,382) 1,787 52,341
INTEREST CHARGES AND FINANCING COSTS:
Interest charges – net of amounts capitalized 657,305 414,277 344,643
Distributions on redeemable preferred securities of subsidiary trusts 38,800 38,800 33,311
Dividend requirements and redemption premium on preferred stock of subsidiaries 5,332
Total interest and financing costs 696,105 453,077 383,286
Income before income taxes and extraordinary items 850,653 750,606 864,721
Income taxes 304,865 179,673 240,391
Income before extraordinary items 545,788 570,933 624,330
Extraordinary items, net of income taxes of $8,549 (see Note 12) (18,960)
Net income 526,828 570,933 624,330
Dividend requirements and redemption premiums on preferred stock 4,241 5,292 5,548
Earnings available for common shareholders $ 522,587 $ 565,641 $ 618,782
WEIGHTED AVERAGE COMMON SHARES OUTSTANDING:
Basic 337,832 331,943 323,883
Diluted 338,111 332,054 324,355
EARNINGS PER SHARE – BASIC AND DILUTED:
Income before extraordinary items $ 1.60 $ 1.70 $ 1.91
Extraordinary items (see Note 12) (0.06)
Earnings per share $ 1.54 $ 1.70 $ 1.91
See Notes to Consolidated Financial Statements
XCEL ENERGY INC. AND SUBSIDIARIES
33
CONSOLIDATED STATEMENTS OF INCOME