Xcel Energy 2000 Annual Report Download - page 22
Download and view the complete annual report
Please find page 22 of the 2000 Xcel Energy annual report below. You can navigate through the pages in the report by either clicking on the pages listed below, or by using the keyword search tool below to find specific information within the annual report.-
 1
1 -
2
-
3
-
4
-
5
-
6
-
7
-
8
-
9
-
10
-
11
-
 12
12 -
 13
13 -
 14
14 -
 15
15 -
 16
16 -
 17
17 -
 18
18 -
 19
19 -
 20
20 -
 21
21 -
 22
22 -
 23
23 -
 24
24 -
 25
25 -
 26
26 -
 27
27 -
 28
28 -
 29
29 -
 30
30 -
 31
31 -
 32
32 -
33
-
34
-
35
-
36
-
37
-
38
-
39
-
40
 |
 |

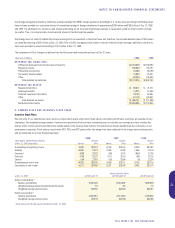
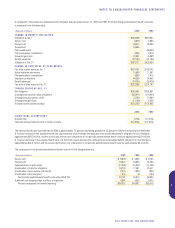
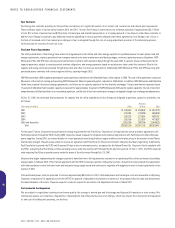
A comparison of the actuarially computed benefit obligation and plan assets at Dec. 31, 2000 and 1999, for all Xcel Energy postretirement health care plans
is presented in the following table.
(Thousands of dollars) 2000 1999
CHANGE IN BENEFIT OBLIGATION
Obligation at Jan. 1 $533,458 $616,957
Service cost 5,679 4,680
Interest cost 43,477 35,583
Acquisitions 16,445
Plan amendments (80,840)
Plan participants’ contributions 4,358 3,818
Actuarial (gain) loss 10,501 (5,581)
Benefit payments (37,191) (41,159)
Obligation at Dec. 31 $ 576,727 $ 533,458
CHANGE IN FAIR VALUE OF PLAN ASSETS
Fair value of plan assets at Jan. 1 $ 201,767 $ 180,742
Actual return on plan assets 10,069 11,981
Plan participants’ contributions 4,358 3,818
Employer contributions 44,263 34,652
Benefit payments (37,191) (29,426)
Fair value of plan assets at Dec. 31 $ 223,266 $ 201,767
FUNDED STATUS AT DEC. 31
Net obligation $ 353,461 $ 331,691
Unrecognized transition asset (obligation) (202,871) (219,644)
Unrecognized prior-service credit 13,789 14,999
Unrecognized gain (loss) (11,126) 5,559
Accrued benefit liability recorded $153,253 $ 132,605
2000 1999
SIGNIFICANT ASSUMPTIONS:
Discount rate 7.75% 7.5–8.0%
Expected average long-term rate of return on assets 8.0–9.5% 8.0–9.5%
The assumed health care cost trend rate for 2000 is approximately 7.5 percent, decreasing gradually to 5.5 percent in 2004 and remaining level thereafter.
A 1-percent increase in the assumed health care cost trend rate would increase the estimated total accumulated benefit obligation for Xcel Energy by
approximately $49.3 million, and the service and interest cost components of net periodic postretirement benefit costs by approximately $3.8 million.
A 1-percent decrease in the assumed health care cost trend rate would decrease the estimated total accumulated benefit obligation for Xcel Energy by
approximately $42.9 million, and the service and interest cost components of net periodic postretirement benefit costs by approximately $3.3 million.
The components of net periodic postretirement benefit cost of all Xcel Energy’s plans are:
(Thousands of dollars) 2000 1999 1998
Service cost $ 5,679 $ 4,680 $ 8,164
Interest cost 43,477 35,583 42,399
Expected return on plan assets (17,902) (15,003) (12,349)
Amortization of transition obligation 16,773 17,461 23,411
Amortization of prior-service cost (credit) (1,211) (1,803) (932)
Amortization of net loss (gain) 915 (5) (790)
Net periodic postretirement benefit costs under SFAS 106 47,731 40,913 59,903
Additional cost recognized due to effects of regulation 6,641 4,029 5,673
Net cost recognized for financial reporting $ 54,372 $ 44,942 $ 65,576
XCEL ENERGY INC. AND SUBSIDIARIES
51
NOTES TO CONSOLIDATED FINANCIAL STATEMENTS