Xcel Energy 2000 Annual Report Download - page 5
Download and view the complete annual report
Please find page 5 of the 2000 Xcel Energy annual report below. You can navigate through the pages in the report by either clicking on the pages listed below, or by using the keyword search tool below to find specific information within the annual report.-
 1
1 -
 2
2 -
 3
3 -
 4
4 -
 5
5 -
 6
6 -
 7
7 -
 8
8 -
 9
9 -
 10
10 -
 11
11 -
 12
12 -
 13
13 -
 14
14 -
 15
15 -
 16
16 -
17
-
18
-
19
-
20
-
21
-
22
-
23
-
24
-
25
-
26
-
27
-
28
-
29
-
30
-
31
-
32
-
33
-
34
-
35
-
36
-
37
-
38
-
39
-
40
 |
 |

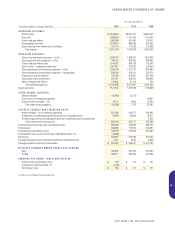
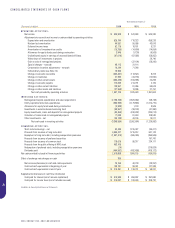
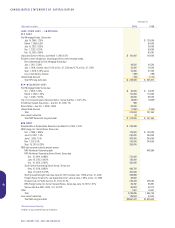
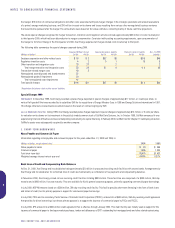
Year ended December 31
(Thousands of dollars) 2000 1999 1998
OPERATING ACTIVITIES:
Net income $ 526,828 $ 570,933 $ 624,330
Adjustments to reconcile net income to cash provided by operating activities:
Depreciation and amortization 828,780 718,323 659,226
Nuclear fuel amortization 44,591 50,056 43,816
Deferred income taxes 62,716 18,161 5,231
Amortization of investment tax credits (15,295) (14,800) (14,654)
Allowance for equity funds used during construction 3,848 (1,130) (8,509)
Undistributed equity in earnings of unconsolidated affiliates (87,019) (67,926) (56,952)
Write-down of investments in projects 26,740
Gain on sale of nonregulated projects (37,194) (26,200)
Special charges – noncash 96,113 31,114
Conservation incentive adjustments – noncash 19,248 71,348
Extraordinary items (see Note 12) 18,960
Change in accounts receivable (443,347) (113,521) 8,373
Change in inventories 21,933 (44,183) (12,550)
Change in other current assets (484,288) (164,995) 22,263
Change in accounts payable 713,069 214,791 2,105
Change in other current liabilities 129,557 81,056 60,618
Change in other assets and liabilities (27,969) 13,396 27,767
Net cash provided by operating activities 1,407,725 1,325,429 1,361,604
INVESTING ACTIVITIES:
Nonregulated capital expenditures and asset acquisitions (2,196,168) (1,620,462) (58,748)
Utility capital/construction expenditures (984,935) (1,178,663) (1,014,710)
Allowance for equity funds used during construction (3,848) 1,130 8,509
Investments in external decommissioning fund (48,967) (39,183) (41,360)
Equity investments, loans and deposits for nonregulated projects (93,366) (240,282) (234,214)
Collection of loans made to nonregulated projects 17,039 81,440 109,530
Other investments – net (36,749) 43,136 10,011
Net cash used in investing activities (3,346,994) (2,952,884) (1,220,982)
FINANCING ACTIVITIES:
Short-term borrowings – net 42,386 1,315,027 (84,471)
Proceeds from issuance of long-term debt 3,565,227 1,215,312 641,123
Repayment of long-term debt, including reacquisition premiums (1,667,315) (465,045) (394,506)
Proceeds from issuance of preferred securities 187,700
Proceeds from issuance of common stock 116,678 95,317 234,171
Proceeds from the public offering of NRG stock 453,705
Redemption of preferred stock, including reacquisition premiums (20) (276,824)
Dividends paid (494,992) (492,456) (476,172)
Net cash provided by (used in) financing activities 2,015,669 1,668,155 (168,979)
Effect of exchange rate changes on cash 360
Net increase (decrease) in cash and cash equivalents 76,760 40,700 (28,357)
Cash and cash equivalents at beginning of year 139,731 99,031 127,388
Cash and cash equivalents at end of year $ 216,491 $ 139,731 $ 99,031
Supplemental disclosure of cash flow information
Cash paid for interest (net of amount capitalized) $ 610,584 $ 458,897 $ 397,680
Cash paid for income taxes (net of refunds received) $ 216,087 $ 193,448 $ 209,781
See Notes to Consolidated Financial Statements
34
XCEL ENERGY INC. AND SUBSIDIARIES
CONSOLIDATED STATEMENTS OF CASH FLOWS