Xcel Energy 2000 Annual Report Download - page 37
Download and view the complete annual report
Please find page 37 of the 2000 Xcel Energy annual report below. You can navigate through the pages in the report by either clicking on the pages listed below, or by using the keyword search tool below to find specific information within the annual report.-
 1
1 -
2
-
3
-
4
-
5
-
6
-
7
-
8
-
9
-
10
-
11
-
12
-
13
-
14
-
15
-
16
-
17
-
18
-
19
-
20
-
21
-
22
-
23
-
24
-
25
-
26
-
 27
27 -
 28
28 -
 29
29 -
 30
30 -
 31
31 -
 32
32 -
 33
33 -
 34
34 -
 35
35 -
 36
36 -
 37
37 -
 38
38 -
 39
39 -
 40
40
 |
 |

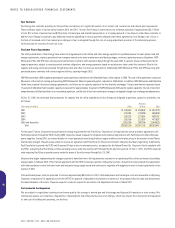
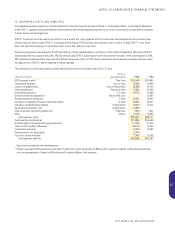
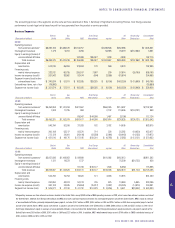
19. SUMMARIZED QUARTERLY FINANCIAL DATA (UNAUDITED)
Quarter Ended
(Thousands of dollars, except per share amounts) March 31, 2000 June 30, 2000 Sept. 30, 2000* Dec. 31, 2000*
Revenue*** $2,322,344 $2,460,509 $3,115,007 $3,693,936
Operating income 364,026 424,754 401,023 381,337
Income before extraordinary items
Extraordinary items
Net income 153,331 143,083 92,614 137,800
Earnings per share before extraordinary items: 152,271 142,022 91,554 136,740
Basic $ 0.45 $ 0.46 $ 0.29 $ 0.40
Diluted $ 0.45 $ 0.46 $ 0.29 $ 0.40
Earnings per share extraordinary items – basic & diluted $ (0.04) $ (0.02)
Earnings per share after extraordinary items:
Basic $ 0.45 $ 0.42 $ 0.27 $ 0.40
Diluted $ 0.45 $ 0.42 $ 0.27 $ 0.40
Quarter Ended
(Thousands of dollars, except per share amounts) March 31, 1999 June 30, 1999** Sept. 30,1999 Dec. 31, 1999**
Revenue*** $1,807,157 $1,654,399 $2,146,695 $2,207,292
Operating income 300,960 184,337 418,277 298,322
Net income 153,621 60,725 209,264 147,323
Earnings available for common stock 152,561 58,615 208,204 146,261
Earnings per share:
Basic $ 0.46 $ 0.18 $ 0.63 $ 0.43
Diluted $ 0.46 $ 0.18 $ 0.63 $ 0.43
*2000 results include special charges related to merger costs and strategic alignment as discussed in Note 2 to the Financial Statements. Third-quarter results were reduced by
approximately $201 million, or 43 cents per share. Fourth-quarter results were reduced by approximately $40 million, or 9 cents per share.
**1999 results include two adjustments related to regulatory recovery of conservation program incentives. Second-quarter results were reduced by $35 million before taxes, or 7 cents
per share, due to the disallowance of 1998 incentives. Fourth-quarter results were reduced by $22 million before taxes, or 4 cents per share, due to the reversal of all income recorded
through the third quarter for 1999 electric conservation program incentives. In addition, 1999 fourth-quarter results include a pretax special charge of approximately $17 million, or
4 cents per share, to write off goodwill related to EMI acquisitions. Also, a pretax special charge of approximately $11 million, or 2 cents per share, was recorded in the fourth quarter
of 1999 to write down an investment in CellNet common stock.
***Trading revenues have been reclassified to reflect presentation on a gross basis for all periods.
66
XCEL ENERGY INC. AND SUBSIDIARIES
NOTES TO CONSOLIDATED FINANCIAL STATEMENTS