Xcel Energy 2000 Annual Report Download - page 23
Download and view the complete annual report
Please find page 23 of the 2000 Xcel Energy annual report below. You can navigate through the pages in the report by either clicking on the pages listed below, or by using the keyword search tool below to find specific information within the annual report.-
 1
1 -
2
-
3
-
4
-
5
-
6
-
7
-
8
-
9
-
10
-
11
-
12
-
 13
13 -
 14
14 -
 15
15 -
 16
16 -
 17
17 -
 18
18 -
 19
19 -
 20
20 -
 21
21 -
 22
22 -
 23
23 -
 24
24 -
 25
25 -
 26
26 -
 27
27 -
 28
28 -
 29
29 -
 30
30 -
 31
31 -
 32
32 -
 33
33 -
34
-
35
-
36
-
37
-
38
-
39
-
40
 |
 |

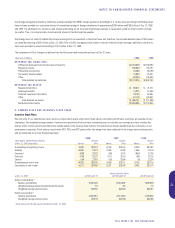
11. INVESTMENTS ACCOUNTED FOR BY THE EQUITY METHOD
Xcel Energy’s nonregulated subsidiaries have investments in various international and domestic energy projects, and domestic affordable housing and real
estate projects. We use the equity method of accounting for such investments in affiliates, which include joint ventures and partnerships. That’s because
the ownership structure prevents Xcel Energy from exercising a controlling influence over the projects’ operating and financial policies. Under this method,
Xcel Energy records its portion of the earnings or losses of unconsolidated affiliates as equity earnings. A summary of Xcel Energy’s significant equity
method investments is listed in the following table.
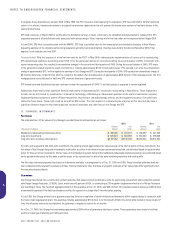
Name Geographic Area Economic Interest
Loy Yang Power A Australia 25.37%
Enfield Energy Centre Europe 25.00%
Yorkshire Power Europe 50.00%
Gladstone Power Station Australia 37.50%
COBEE (Bolivian Power Co. Ltd.) South America 49.10%
MIBRAG mbH Europe 33.33%
Cogeneration Corp. of America USA 20.00%
Schkopau Power Station Europe 20.95%
Long Beach Generating USA 50.00%
El Segundo Generating USA 50.00%
Encina USA 50.00%
San Diego Combustion Turbines USA 50.00%
Energy Developments Limited Australia 29.14%
Scudder Latin American Power Latin America 6.63%
Various independent power production facilities USA 45–50%
Various affordable housing limited partnerships USA 20–99.9%
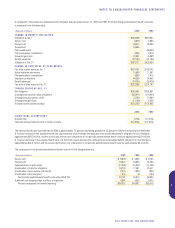
The following table summarizes financial information for these projects, including interests owned by Xcel Energy and other parties for the years ended Dec. 31.
RESULTS OF OPERATIONS
(Millions of dollars) 2000 1999 1998
Operating revenues $4,664 $4,087 $3,791
Operating income $ 464 $ 516 $ 530
Net income (losses) $ 447 $ 290 $ 220
Xcel Energy’s equity earnings of unconsolidated affiliates $ 184 $ 113 $ 119
FINANCIAL POSITION
(Millions of dollars) 2000 1999
Current assets $ 1,590 $ 1,198
Other assets 10,939 10,877
Total assets $12,529 $12,075
Current liabilities $ 1,833 $ 1,384
Other liabilities 6,806 7,719
Equity 3,890 2,972
Total liabilities and equity $12,529 $12,075
Subsequent Event
In late February 2001, Xcel Energy reached an agreement in principle to sell at book value all of its investment in Yorkshire Power except for an interest
of approximately 5 percent. Xcel Energy is retaining this interest to comply with pooling-of-interests accounting requirements associated with the merger of
NSP and NCE in 2000. Following completion of the transaction, proceeds of the sale will be used by Xcel Energy to pay down short-term debt and eliminate
an equity issuance planned for the second half of 2001.
52
XCEL ENERGY INC. AND SUBSIDIARIES
NOTES TO CONSOLIDATED FINANCIAL STATEMENTS