Xcel Energy 2000 Annual Report Download - page 18
Download and view the complete annual report
Please find page 18 of the 2000 Xcel Energy annual report below. You can navigate through the pages in the report by either clicking on the pages listed below, or by using the keyword search tool below to find specific information within the annual report.-
 1
1 -
2
-
3
-
4
-
5
-
6
-
7
-
 8
8 -
 9
9 -
 10
10 -
 11
11 -
 12
12 -
 13
13 -
 14
14 -
 15
15 -
 16
16 -
 17
17 -
 18
18 -
 19
19 -
 20
20 -
 21
21 -
 22
22 -
 23
23 -
 24
24 -
 25
25 -
 26
26 -
 27
27 -
 28
28 -
29
-
30
-
31
-
32
-
33
-
34
-
35
-
36
-
37
-
38
-
39
-
40
 |
 |

Xcel Energy management intends to indefinitely reinvest earnings from NRG’s foreign operations. Accordingly, U.S. income taxes and foreign withholding taxes
have not been provided on a cumulative amount of unremitted earnings of foreign subsidiaries of approximately $238 million and $195 million at Dec. 31, 2000
and 1999. The additional U.S. income tax and foreign withholding tax on the unremitted foreign earnings, if repatriated, would be offset in part by foreign
tax credits. Thus, it is not practicable to estimate the amount of tax that might be payable.
Xcel Energy does not intend to indefinitely reinvest earnings from its investment in Yorkshire Power and, therefore, has provided deferred taxes of $20 million
on unremitted earnings of $55 million at Dec. 31, 2000. Prior to 2000, management did intend to reinvest Yorkshire Power earnings indefinitely, and thus no
taxes were provided on unremitted earnings of $11 million at Dec. 31, 1999.
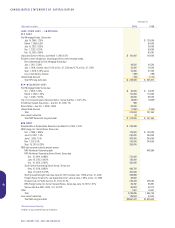
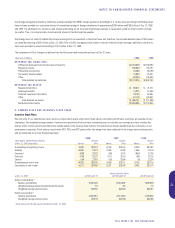
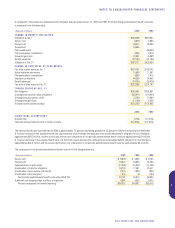
The components of Xcel Energy’s net deferred tax liability (current and noncurrent portions) at Dec. 31 were:
(Thousands of dollars) 2000 1999
DEFERRED TAX LIABILITIES:
Differences between book and tax bases of property $1,754,928 $1,739,394
Regulatory assets 168,380 143,187
Partnership income/loss 70,266 36,756
Tax benefit transfer leases 18,839 23,431
Other 98,263 106,932
Total deferred tax liabilities $2,110,676 $2,049,700
DEFERRED TAX ASSETS:
Regulatory liabilities $ 88,817 $ 71,471
Employee benefits 14,675 13,493
Deferred investment tax credits 76,133 83,061
Other 87,116 103,041
Total deferred tax assets $ 266,741 $ 271,066
Net deferred tax liability $1,843,935 $1,778,634
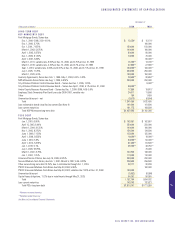
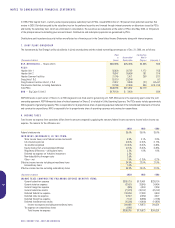
9. COMMON STOCK AND INCENTIVE STOCK PLANS
Incentive Stock Plans
We and some of our subsidiaries have incentive compensation plans under which stock options and other performance incentives are awarded to key
employees. The weighted average number of common and potentially dilutive shares outstanding used to calculate our earnings per share includes the
dilutive effect of stock options and other stock awards based on the treasury stock method. The tables below include awards made by us and some of our
predecessor companies. Stock options issued under NCE, PSCo and SPS plans before the merger have been adjusted for the merger stock exchange ratio
and are presented on an Xcel Energy share basis.
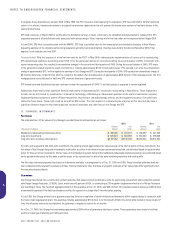
2000 1999 1998
Stock Options and Performance Awards Average Average Average
at Dec. 31, 2000 (Thousands) Awards Price Awards Price Awards Price
Outstanding at beginning of year 8,490 $25.12 6,156 $26.15 5,439 $24.92
Granted 6,980 25.31 2,545 22.64 1,456 29.19
Exercised (453) 20.33 (90) 18.72 (636) 22.36
Forfeited (704) 25.70 (111) 30.10 (94) 28.15
Expired (54) 22.62 (10) 25.64 (9) 23.24
Outstanding at end of year 14,259 $25.35 8,490 $25.12 6,156 $26.15
Exercisable at end of year 8,221 $24.46 5,301 $25.84 4,405 $25.14
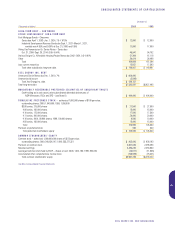
Range of Exercise Prices
at Dec. 31, 2000 $16.60 to $21.75 $22.50 to $27.99 $28.00 to $31.00
Options outstanding:*
Number outstanding 3,245,478 9,616,092 1,388,878
Weighted average remaining contractual life (years) 7.6 8.3 7.4
Weighted average exercise price $19.82 $26.44 $30.67
Options exercisable:*
Number exercisable 2,820,681 4,212,023 1,180,324
Weighted average exercise price $19.78 $25.86 $30.65
*There were also 8,259 other awards outstanding at Dec. 31, 2000.
XCEL ENERGY INC. AND SUBSIDIARIES
47
NOTES TO CONSOLIDATED FINANCIAL STATEMENTS