WeightWatchers 2009 Annual Report Download - page 99
Download and view the complete annual report
Please find page 99 of the 2009 WeightWatchers annual report below. You can navigate through the pages in the report by either clicking on the pages listed below, or by using the keyword search tool below to find specific information within the annual report.-
 1
1 -
2
-
3
-
4
-
5
-
6
-
7
-
8
-
9
-
10
-
11
-
12
-
13
-
14
-
15
-
16
-
17
-
18
-
19
-
20
-
21
-
22
-
23
-
24
-
25
-
26
-
27
-
28
-
29
-
30
-
31
-
32
-
33
-
34
-
35
-
36
-
37
-
38
-
39
-
40
-
41
-
42
-
43
-
44
-
45
-
46
-
47
-
48
-
49
-
50
-
51
-
52
-
53
-
54
-
55
-
56
-
57
-
58
-
59
-
60
-
61
-
62
-
63
-
64
-
65
-
66
-
67
-
68
-
69
-
70
-
71
-
72
-
73
-
74
-
75
-
76
-
77
-
78
-
79
-
80
-
81
-
82
-
83
-
84
-
85
-
86
-
87
-
88
-
 89
89 -
 90
90 -
 91
91 -
 92
92 -
 93
93 -
 94
94 -
 95
95 -
 96
96 -
 97
97 -
 98
98 -
 99
99 -
 100
100 -
 101
101 -
 102
102 -
 103
103 -
 104
104 -
 105
105 -
 106
106 -
 107
107 -
 108
108 -
 109
109 -
110
-
111
-
112
-
113
-
114
-
115
-
116
-
117
-
118
-
119
-
120
 |
 |

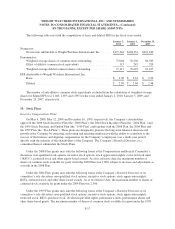
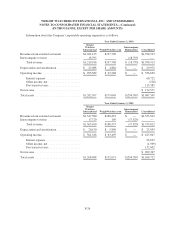
WEIGHT WATCHERS INTERNATIONAL, INC. AND SUBSIDIARIES
NOTES TO CONSOLIDATED FINANCIAL STATEMENTS—(Continued)
(IN THOUSANDS, EXCEPT PER SHARE AMOUNTS)
Year Ended December 29, 2007
Weight
Watchers
International WeightWatchers.com
Intercompany
Eliminations Consolidated
Revenues from external customers ............ $1,313,083 $154,084 $ — $1,467,167
Intercompany revenue ...................... 14,536 3,571 (18,107) —
Total revenue ......................... $1,327,619 $157,655 (18,107) $1,467,167
Depreciation and amortization ................ $ 16,400 $ 4,346 $ — $ 20,746
Operating income .......................... $ 384,457 $ 51,150 $ — $ 435,607
Interest expense ....................... 109,277
Other income, net ...................... (3,182)
Early extinguishment of debt ............. 3,021
Provision for taxes ..................... 125,311
Net income ............................... $ 201,180
Total assets ............................... $1,247,569 $ 92,971 $(294,319) $1,046,221
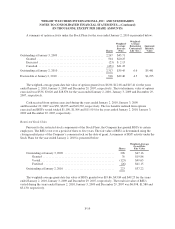
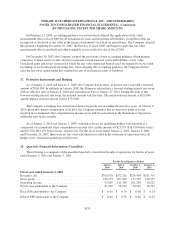
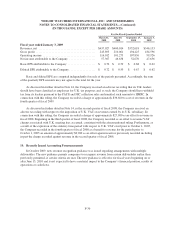
The following table presents information about the Company’s sources of revenue and other information by
geographic area. There were no material amounts of sales or transfers among geographic areas and no material
amounts of United States export sales.
Revenues for the Year Ended
January 2,
2010
January 3,
2009
December 29,
2007
NACO meeting fees ......................................... $ 546,957 $ 625,277 $ 603,730
International Company-owned meeting fees ...................... 270,566 282,807 276,994
Product sales ............................................... 292,086 339,775 337,659
Franchise royalties .......................................... 13,078 16,186 17,039
Internet revenues ............................................ 195,985 185,806 151,625
Other ..................................................... 80,241 85,961 80,120
$1,398,913 $1,535,812 $1,467,167
Revenues for the Year Ended
January 2,
2010
January 3,
2009
December 29,
2007
North America ............................................. $ 915,789 $1,016,698 $ 972,976
United Kingdom ............................................ 178,579 180,114 199,240
Continental Europe .......................................... 248,773 281,053 237,196
Australia, New Zealand and other .............................. 55,772 57,947 57,755
$1,398,913 $1,535,812 $1,467,167
F-27