WeightWatchers 2009 Annual Report Download - page 59
Download and view the complete annual report
Please find page 59 of the 2009 WeightWatchers annual report below. You can navigate through the pages in the report by either clicking on the pages listed below, or by using the keyword search tool below to find specific information within the annual report.-
 1
1 -
2
-
3
-
4
-
5
-
6
-
7
-
8
-
9
-
10
-
11
-
12
-
13
-
14
-
15
-
16
-
17
-
18
-
19
-
20
-
21
-
22
-
23
-
24
-
25
-
26
-
27
-
28
-
29
-
30
-
31
-
32
-
33
-
34
-
35
-
36
-
37
-
38
-
39
-
40
-
41
-
42
-
43
-
44
-
45
-
46
-
47
-
48
-
 49
49 -
 50
50 -
 51
51 -
 52
52 -
 53
53 -
 54
54 -
 55
55 -
 56
56 -
 57
57 -
 58
58 -
 59
59 -
 60
60 -
 61
61 -
 62
62 -
 63
63 -
 64
64 -
 65
65 -
 66
66 -
 67
67 -
 68
68 -
 69
69 -
70
-
71
-
72
-
73
-
74
-
75
-
76
-
77
-
78
-
79
-
80
-
81
-
82
-
83
-
84
-
85
-
86
-
87
-
88
-
89
-
90
-
91
-
92
-
93
-
94
-
95
-
96
-
97
-
98
-
99
-
100
-
101
-
102
-
103
-
104
-
105
-
106
-
107
-
108
-
109
-
110
-
111
-
112
-
113
-
114
-
115
-
116
-
117
-
118
-
119
-
120
 |
 |
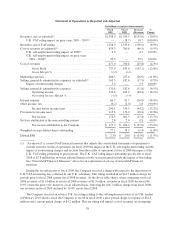
compared to 14.6% in the prior year as adjusted for the impact of the U.K. VAT ruling. Excluding the impact of
foreign currency exchange, the year-over-year decrease in marketing expense was $17.0 million, or 7.5%. The
meeting room business drove the decline which resulted from a combination of advertising rate efficiencies and
cost containment efforts across our geographies, particularly in Continental Europe.
Selling, general and administrative expenses were $170.8 million for fiscal 2009 versus $182.6 million for
fiscal 2008, a decrease of $11.8 million, or 6.5%. Our selling, general and administrative expenses in fiscal 2009
included $5.5 million of restructuring charges associated with our cost savings initiatives and also included a
$5.9 million benefit from foreign currency translation. Excluding the restructuring charges and the benefit from
foreign currency translation, selling, general and administrative expenses were $171.2 million for fiscal 2009, a
decrease of $11.4 million, or 6.2%, from the prior year, reflecting cost savings from restructuring and other
initiatives that began to have an impact in the second quarter of fiscal 2009. Selling, general and administrative
expenses declined despite higher investment with respect to our China Joint Venture and increased depreciation
resulting from our information technology investments. Our selling, general and administrative expenses were
12.2% of revenues for fiscal 2009. Excluding the negative impact of restructuring charges from our fiscal 2009
results and excluding the impact of the U.K. VAT ruling from our fiscal 2008 results, selling, general and
administrative expenses as a percent of revenues were 11.8% and 11.7%, respectively.
Our operating income for fiscal 2009 was $356.6 million, a decrease of $68.4 million, or 16.1%, from the
fiscal 2008 level. Excluding the impact of the adverse U.K. tax rulings from both years and the restructuring
charges from fiscal 2009, our operating income for fiscal 2009 declined by $44.9 million, or 10.1%, from $443.7
million in fiscal 2008 to $398.8 million in fiscal 2009. Foreign currency exchange accounted for $15.2 million,
or 3.4%, of decline. On a constant currency basis, fiscal 2009 operating income, as adjusted for the U.K. self-
employment ruling and for restructuring charges, decreased $29.7 million, or 6.7%, versus the prior year as
adjusted for the U.K. VAT ruling in fiscal 2008. Volume declines were partially offset by lower marketing
expenses and cost savings initiatives across most major expense categories.
Our operating income margin for fiscal 2009 was 25.5% versus 27.7% for fiscal 2008. Excluding the U.K.
self-employment ruling and the restructuring charges in fiscal 2009 and adjusting fiscal 2008 for the U.K. VAT
ruling, our adjusted operating income margin was flat at 28.5% in both fiscal 2009 and fiscal 2008.
Interest expense was $66.7 million for fiscal 2009, a decrease of $26.0 million, or 28.0%, from $92.7
million in fiscal 2008. The Company’s average effective interest rate declined 127 basis points, down from
5.44% in fiscal 2008 to 4.17% in fiscal 2009, mainly as a result of lower market rates. During 2009, we made
debt payments of $194.5 million, reducing our debt outstanding under our credit facility to $1.453 billion at the
end of fiscal 2009 as compared to $1.648 billion at the end of fiscal 2008.
We reported other income of $0.2 million in fiscal 2009 as compared to $2.0 million in the comparable prior
year period. The change resulted primarily from the impact of foreign currency exchange rates on intercompany
transactions.
The Company’s effective tax rate was 39.8% in fiscal 2009 and 39.5% in fiscal 2008. Our tax rate for both
years was inflated as charges associated with the U.K. tax rulings in 2009 and 2008 resulted in changes in the
geographic mix of our income in both years. Excluding the U.K. tax rulings, the effective tax rate was 38.7% in
fiscal 2009 and 39.1% in fiscal 2008.
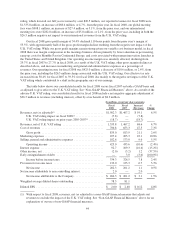
Comparison of Fiscal 2008 (53 weeks) to Fiscal 2007 (52 weeks)
Certain key metrics were significantly negatively affected by net offsets to revenue recorded in fiscal 2008
resulting from the adverse U.K. VAT ruling received by the Company during the second quarter 2008 with
respect to the imposition of VAT on meeting fees collected by our U.K. subsidiary. We discuss the U.K. VAT
ruling in Note 14 of our Consolidated Financial Statements. After accounting for the aforementioned U.K. VAT
43