WeightWatchers 2009 Annual Report Download - page 55
Download and view the complete annual report
Please find page 55 of the 2009 WeightWatchers annual report below. You can navigate through the pages in the report by either clicking on the pages listed below, or by using the keyword search tool below to find specific information within the annual report.-
 1
1 -
2
-
3
-
4
-
5
-
6
-
7
-
8
-
9
-
10
-
11
-
12
-
13
-
14
-
15
-
16
-
17
-
18
-
19
-
20
-
21
-
22
-
23
-
24
-
25
-
26
-
27
-
28
-
29
-
30
-
31
-
32
-
33
-
34
-
35
-
36
-
37
-
38
-
39
-
40
-
41
-
42
-
43
-
44
-
 45
45 -
 46
46 -
 47
47 -
 48
48 -
 49
49 -
 50
50 -
 51
51 -
 52
52 -
 53
53 -
 54
54 -
 55
55 -
 56
56 -
 57
57 -
 58
58 -
 59
59 -
 60
60 -
 61
61 -
 62
62 -
 63
63 -
 64
64 -
 65
65 -
66
-
67
-
68
-
69
-
70
-
71
-
72
-
73
-
74
-
75
-
76
-
77
-
78
-
79
-
80
-
81
-
82
-
83
-
84
-
85
-
86
-
87
-
88
-
89
-
90
-
91
-
92
-
93
-
94
-
95
-
96
-
97
-
98
-
99
-
100
-
101
-
102
-
103
-
104
-
105
-
106
-
107
-
108
-
109
-
110
-
111
-
112
-
113
-
114
-
115
-
116
-
117
-
118
-
119
-
120
 |
 |

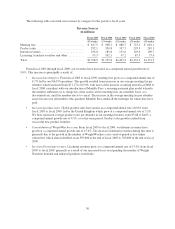
basis. As the table above shows, our cost of revenues decreased by $29.8 million from $700.8 million in fiscal
2008 to $671.0 million in fiscal 2009, a decrease of 4.3%; however, on an adjusted basis, removing the aggregate
$36.7 million charge from fiscal 2009, our cost of revenues in fiscal 2009 actually declined by 9.5% versus fiscal
2008.
The table above shows that, including the impact of these charges, the Company’s fiscal 2009 gross profit
was $727.9 million, as compared to $835.0 million in fiscal 2008, a decrease of $107.1 million or 12.8%, and
that our gross profit margin of 52.0% declined 240 basis points from the prior year’s gross profit margin of
54.4%.
In addition to the two adjustments for the U.K. tax rulings noted above, the Company recorded $5.5 million
of restructuring charges in fiscal 2009 associated with the cost savings initiatives announced in the first quarter of
fiscal 2009. Selling, general and administrative expenses were 6.5% lower in fiscal 2009 versus fiscal 2008.
Excluding the restructuring charges in fiscal 2009, selling, general and administrative expenses were $17.3
million, or 9.5%, lower than in fiscal 2008.
Fiscal 2009 operating income of $356.6 million declined $68.4 million, or 16.1%, from the fiscal 2008 level
of $425.0 million, and fiscal 2009 operating income margin declined to 25.5% compared to 27.7% in fiscal 2008.
Net income attributable to the Company of $177.3 million in fiscal 2009 was reduced by after-tax charges of
$25.6 million related to the adverse U.K. tax ruling relating to the self-employment status of the Company’s U.K.
leaders and $3.4 million for restructuring charges. Fiscal 2009 net income attributable to the Company declined
$27.0 million, or 13.2%, from $204.3 million in fiscal 2008, which included after-tax charges of $12.7 million
for the adverse U.K. VAT ruling. Fiscal 2009 diluted earnings per share of $2.30, including $0.38 of decline for
the two fiscal 2009 items noted above, compared to $2.60 in fiscal 2008, which included $0.17 of decline related
to the fiscal 2008 charge noted above.
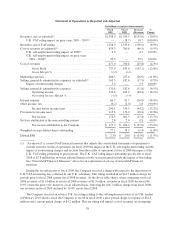
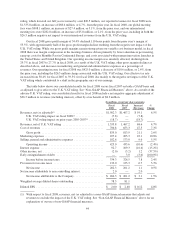
The table below illustrates the Company’s fiscal 2009 and fiscal 2008 results for certain selected financial
data on a comparable basis, after all adjustments as noted and discussed above are reflected.
Summary of Selected Financial Data as Adjusted
(In millions, except per share amounts)
As Adjusted(1)
Fiscal
2009
Fiscal
2008
Increase/
(Decrease)
%
Change
Revenues, net ............................................ $1,398.9 $1,554.5 $(155.6) (10.0%)
Cost of revenues .......................................... 634.3 700.8 (66.5) (9.5%)
Gross Profit ......................................... 764.6 853.7 (89.1) (10.4%)
Gross Margin % ...................................... 54.7% 54.9%
Marketing expenses ....................................... 200.5 227.4 (26.9) (11.8%)
Selling, general & administrative expenses ..................... 165.3 182.6 (17.3) (9.5%)
Operating income ..................................... 398.8 443.7 (44.9) (10.1%)
Operating Income Margin % ............................ 28.5% 28.5%
Net income attributable to the Company ....................... $ 206.3 $ 217.0 $ (10.7) (4.9%)
Weighted average diluted shares outstanding ................... 77.1 78.5 (1.4) (1.8%)
Diluted EPS ............................................. $ 2.68 $ 2.77 $ (0.09) (3.2%)
(1) “As adjusted” is a non-GAAP financial measure that adjusts the consolidated statements of operations to
exclude from the results of operations for fiscal 2009 the impact of the U.K. self-employment ruling and the
impact of restructuring charges and exclude from the results of operations for fiscal 2008 the impact of the
U.K. VAT ruling pertaining to periods prior to fiscal 2008. The U.K. VAT ruling impact pertaining
39