WeightWatchers 2009 Annual Report Download - page 100
Download and view the complete annual report
Please find page 100 of the 2009 WeightWatchers annual report below. You can navigate through the pages in the report by either clicking on the pages listed below, or by using the keyword search tool below to find specific information within the annual report.-
 1
1 -
2
-
3
-
4
-
5
-
6
-
7
-
8
-
9
-
10
-
11
-
12
-
13
-
14
-
15
-
16
-
17
-
18
-
19
-
20
-
21
-
22
-
23
-
24
-
25
-
26
-
27
-
28
-
29
-
30
-
31
-
32
-
33
-
34
-
35
-
36
-
37
-
38
-
39
-
40
-
41
-
42
-
43
-
44
-
45
-
46
-
47
-
48
-
49
-
50
-
51
-
52
-
53
-
54
-
55
-
56
-
57
-
58
-
59
-
60
-
61
-
62
-
63
-
64
-
65
-
66
-
67
-
68
-
69
-
70
-
71
-
72
-
73
-
74
-
75
-
76
-
77
-
78
-
79
-
80
-
81
-
82
-
83
-
84
-
85
-
86
-
87
-
88
-
89
-
 90
90 -
 91
91 -
 92
92 -
 93
93 -
 94
94 -
 95
95 -
 96
96 -
 97
97 -
 98
98 -
 99
99 -
 100
100 -
 101
101 -
 102
102 -
 103
103 -
 104
104 -
 105
105 -
 106
106 -
 107
107 -
 108
108 -
 109
109 -
 110
110 -
111
-
112
-
113
-
114
-
115
-
116
-
117
-
118
-
119
-
120
 |
 |

WEIGHT WATCHERS INTERNATIONAL, INC. AND SUBSIDIARIES
NOTES TO CONSOLIDATED FINANCIAL STATEMENTS—(Continued)
(IN THOUSANDS, EXCEPT PER SHARE AMOUNTS)
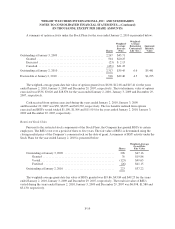
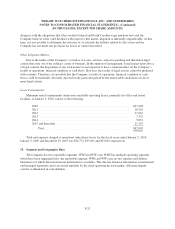
Long-Lived Assets
January 2,
2010
January 3,
2009
December 29,
2007
North America ................................................ $832,012 $828,580 $799,587
United Kingdom ............................................... 17,015 13,919 17,969
Continental Europe ............................................. 6,931 7,131 6,795
Australia, New Zealand and other ................................. 21,703 16,277 16,392
$877,661 $865,907 $840,743
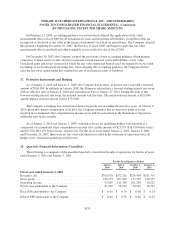
16. Fair Value Measurements
Accounting guidance on fair value measurements for certain financial assets and liabilities requires that
assets and liabilities carried at fair value be classified and disclosed in one of the following three categories:
• Level 1—Quoted prices in active markets for identical assets or liabilities.
• Level 2—Observable inputs other than Level 1 prices, such as quoted prices for similar assets or
liabilities; quoted prices in markets that are not active; or other inputs that are observable or can be
corroborated by observable market data for substantially the full term of the assets or liabilities.
• Level 3—Unobservable inputs that are supported by little or no market activity and that are significant
to the fair value of the assets or liabilities.
When measuring fair value, the Company is required to maximize the use of observable inputs and
minimize the use of unobservable inputs.
Fair Value of Financial Instruments:
The Company’s significant financial instruments include long-term debt and interest rate swap agreements.
The fair value of the Company’s long-term debt is determined by utilizing average bid prices on or near the
end of each fiscal quarter. As of January 2, 2010, the fair value of the Company’s long-term debt was
approximately $1,401,870.
Derivative Financial Instruments
The fair values for the Company’s derivative financial instruments are determined using observable current
market information such as the prevailing LIBOR interest rate and LIBOR yield curve rates and include
consideration of counterparty credit risk. See Note 17 for disclosures related to derivative financial instruments.
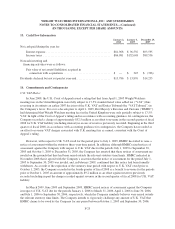
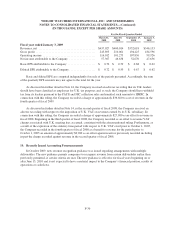
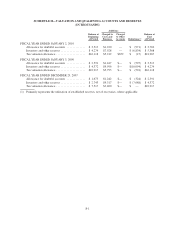
The following table presents the aggregate fair value of the Company’s derivative financial instruments:
Fair Value Measurements Using:
Total
Fair
Value
Quoted Prices in
Active Markets
for Identical Assets
(Level 1)
Significant Other
Observable Inputs
(Level 2)
Significant
Unobservable
Inputs
(Level 3)
Interest rate swap asset at January 2, 2010 ....... $ 1,692 $— $ 1,692 $—
Interest rate swap asset at January 3, 2009 ....... $ — $— $ — $—
Interest rate swap liability at January 2, 2010 ..... $40,947 $— $40,947 $—
Interest rate swap liability at January 3, 2009 ..... $61,532 $— $61,532 $—
F-28