WeightWatchers 2009 Annual Report Download - page 91
Download and view the complete annual report
Please find page 91 of the 2009 WeightWatchers annual report below. You can navigate through the pages in the report by either clicking on the pages listed below, or by using the keyword search tool below to find specific information within the annual report.-
 1
1 -
2
-
3
-
4
-
5
-
6
-
7
-
8
-
9
-
10
-
11
-
12
-
13
-
14
-
15
-
16
-
17
-
18
-
19
-
20
-
21
-
22
-
23
-
24
-
25
-
26
-
27
-
28
-
29
-
30
-
31
-
32
-
33
-
34
-
35
-
36
-
37
-
38
-
39
-
40
-
41
-
42
-
43
-
44
-
45
-
46
-
47
-
48
-
49
-
50
-
51
-
52
-
53
-
54
-
55
-
56
-
57
-
58
-
59
-
60
-
61
-
62
-
63
-
64
-
65
-
66
-
67
-
68
-
69
-
70
-
71
-
72
-
73
-
74
-
75
-
76
-
77
-
78
-
79
-
80
-
 81
81 -
 82
82 -
 83
83 -
 84
84 -
 85
85 -
 86
86 -
 87
87 -
 88
88 -
 89
89 -
 90
90 -
 91
91 -
 92
92 -
 93
93 -
 94
94 -
 95
95 -
 96
96 -
 97
97 -
 98
98 -
 99
99 -
 100
100 -
 101
101 -
102
-
103
-
104
-
105
-
106
-
107
-
108
-
109
-
110
-
111
-
112
-
113
-
114
-
115
-
116
-
117
-
118
-
119
-
120
 |
 |

WEIGHT WATCHERS INTERNATIONAL, INC. AND SUBSIDIARIES
NOTES TO CONSOLIDATED FINANCIAL STATEMENTS—(Continued)
(IN THOUSANDS, EXCEPT PER SHARE AMOUNTS)
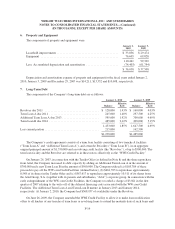
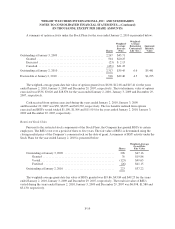
A summary of option activity under the Stock Plans for the year ended January 2, 2010 is presented below:
Shares
Weighted-
Average
Exercise
Price
Weighted-
Average
Remaining
Contractual
Life (Yrs.)
Aggregate
Intrinsic
Value
Outstanding at January 3, 2009 ............................... 2,267 $43.71
Granted ............................................. 504 $20.25
Exercised ............................................ (23) $ 2.13
Canceled ............................................ (431) $41.43
Outstanding at January 2, 2010 ............................... 2,317 $39.45 6.6 $5,441
Exercisable at January 2, 2010 ............................... 916 $42.46 4.3 $1,195
The weighted-average grant-date fair value of options granted was $6.00, $12.08 and $15.41 for the years
ended January 2, 2010, January 3, 2009 and December 29, 2007, respectively. The total intrinsic value of options
exercised was $536, $3,026 and $28,876 for the years ended January 2, 2010, January 3, 2009 and December 29,
2007, respectively.
Cash received from options exercised during the years ended January 2, 2010, January 3, 2009
and December 29, 2007 was $50, $8,075 and $18,563, respectively. The tax benefits realized from options
exercised and RSUs vested totaled $1,190, $1,504 and $11,919 for the years ended January 2, 2010, January 3,
2009 and December 29, 2007, respectively.
Restricted Stock Units
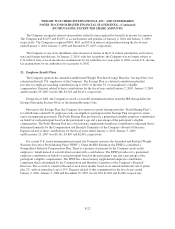
Pursuant to the restricted stock components of the Stock Plans, the Company has granted RSUs to certain
employees. The RSUs vest over a period of three to five years. The fair value of RSUs is determined using the
closing market price of the Company’s common stock on the date of grant. A summary of RSU activity under the
Stock Plans for the year ended January 2, 2010 is presented below:
Shares
Weighted-Average
Grant-Date
Fair Value
Outstanding at January 3, 2009 .................................. 296 $47.16
Granted ................................................. 76 $19.86
Vested .................................................. (123) $49.63
Forfeited ................................................ (26) $41.15
Outstanding at January 2, 2010 .................................. 223 $37.22
The weighted-average grant-date fair value of RSUs granted was $19.86, $43.84 and $49.25 for the years
ended January 2, 2010, January 3, 2009 and December 29, 2007, respectively. The total fair value of RSUs
vested during the years ended January 2, 2010, January 3, 2009 and December 29, 2007 was $6,098, $1,580 and
$3,130, respectively.
F-19