WeightWatchers 2009 Annual Report Download - page 46
Download and view the complete annual report
Please find page 46 of the 2009 WeightWatchers annual report below. You can navigate through the pages in the report by either clicking on the pages listed below, or by using the keyword search tool below to find specific information within the annual report.-
 1
1 -
2
-
3
-
4
-
5
-
6
-
7
-
8
-
9
-
10
-
11
-
12
-
13
-
14
-
15
-
16
-
17
-
18
-
19
-
20
-
21
-
22
-
23
-
24
-
25
-
26
-
27
-
28
-
29
-
30
-
31
-
32
-
33
-
34
-
35
-
 36
36 -
 37
37 -
 38
38 -
 39
39 -
 40
40 -
 41
41 -
 42
42 -
 43
43 -
 44
44 -
 45
45 -
 46
46 -
 47
47 -
 48
48 -
 49
49 -
 50
50 -
 51
51 -
 52
52 -
 53
53 -
 54
54 -
 55
55 -
 56
56 -
57
-
58
-
59
-
60
-
61
-
62
-
63
-
64
-
65
-
66
-
67
-
68
-
69
-
70
-
71
-
72
-
73
-
74
-
75
-
76
-
77
-
78
-
79
-
80
-
81
-
82
-
83
-
84
-
85
-
86
-
87
-
88
-
89
-
90
-
91
-
92
-
93
-
94
-
95
-
96
-
97
-
98
-
99
-
100
-
101
-
102
-
103
-
104
-
105
-
106
-
107
-
108
-
109
-
110
-
111
-
112
-
113
-
114
-
115
-
116
-
117
-
118
-
119
-
120
 |
 |

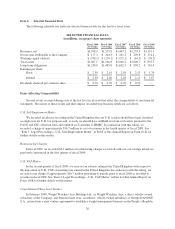
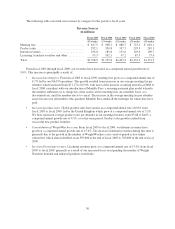
The following table sets forth our revenues by category for the past five fiscal years.
Revenue Sources
(in millions)
Fiscal 2009 Fiscal 2008 Fiscal 2007 Fiscal 2006 Fiscal 2005
(52 weeks) (53 weeks) (52 weeks) (52 weeks) (52 weeks)
Meeting fees ................................ $ 817.5 $ 908.1 $ 880.7 $ 723.1 $ 681.1
Product sales ................................ 292.1 339.8 337.7 293.3 285.5
Internet revenues ............................. 196.0 185.8 151.6 129.4 109.7
Licensing, franchise royalties and other ........... 93.3 102.1 97.2 87.5 75.0
Total ....................................... $1,398.9 $1,535.8 $1,467.2 $1,233.3 $1,151.3
From fiscal 2005 through fiscal 2009, our revenues have increased at a compound annual growth rate of
5.0%. This increase is principally a result of:
•Increased meeting fees. From fiscal 2005 to fiscal 2009, meeting fees grew at a compound annual rate of
4.7% led by our NACO operations. This growth resulted from increases in our average meeting fee per
attendee which increased from $11.17 to $15.06, with most of the increase occurring from fiscal 2006 to
fiscal 2008 coincident with our introduction of Monthly Pass, a recurring payment plan model whereby
the member authorizes us to charge his or her credit card for meeting fees on a monthly basis, at a
discounted rate, until the member elects to cancel. The increase in the average meeting fee per attendee
arises because not all members who purchase Monthly Pass attend all the meetings for which they have
paid.
•Increased product sales. Global product sales have grown at a compound annual rate of 0.6% from
fiscal 2005 to fiscal 2009, led by the United Kingdom which grew at a compound annual rate of 3.1%.
We have increased average product sales per attendee in our meetings business from $3.88 to $4.63, a
compound annual growth rate of 4.5%, over the same period. Product sales growth resulted from
successful new product launches.
•Consolidation of WeightWatchers.com. From fiscal 2005 to fiscal 2009, our Internet revenues have
grown at a compound annual growth rate of 15.6%. The increase in Internet revenues during this time is
primarily due to the growth in the number of WeightWatchers.com’s end-of-period active online
subscribers which almost doubled, from 399,000 at the end of fiscal 2005 to 763,000 at the end of fiscal
2009.
•Increased licensing revenues. Licensing revenues grew at a compound annual rate of 13.6% from fiscal
2005 to fiscal 2009, primarily as a result of our increased focus on expanding the number of Weight
Watchers branded and endorsed products worldwide.
30