WeightWatchers 2009 Annual Report Download - page 54
Download and view the complete annual report
Please find page 54 of the 2009 WeightWatchers annual report below. You can navigate through the pages in the report by either clicking on the pages listed below, or by using the keyword search tool below to find specific information within the annual report.-
 1
1 -
2
-
3
-
4
-
5
-
6
-
7
-
8
-
9
-
10
-
11
-
12
-
13
-
14
-
15
-
16
-
17
-
18
-
19
-
20
-
21
-
22
-
23
-
24
-
25
-
26
-
27
-
28
-
29
-
30
-
31
-
32
-
33
-
34
-
35
-
36
-
37
-
38
-
39
-
40
-
41
-
42
-
43
-
 44
44 -
 45
45 -
 46
46 -
 47
47 -
 48
48 -
 49
49 -
 50
50 -
 51
51 -
 52
52 -
 53
53 -
 54
54 -
 55
55 -
 56
56 -
 57
57 -
 58
58 -
 59
59 -
 60
60 -
 61
61 -
 62
62 -
 63
63 -
 64
64 -
65
-
66
-
67
-
68
-
69
-
70
-
71
-
72
-
73
-
74
-
75
-
76
-
77
-
78
-
79
-
80
-
81
-
82
-
83
-
84
-
85
-
86
-
87
-
88
-
89
-
90
-
91
-
92
-
93
-
94
-
95
-
96
-
97
-
98
-
99
-
100
-
101
-
102
-
103
-
104
-
105
-
106
-
107
-
108
-
109
-
110
-
111
-
112
-
113
-
114
-
115
-
116
-
117
-
118
-
119
-
120
 |
 |

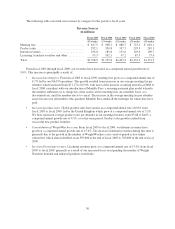
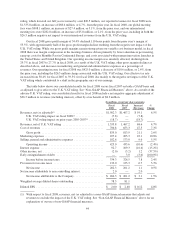
Statement of Operations as Reported and Adjusted
(In millions, except per share amounts)
Fiscal
2009
Fiscal
2008
Increase/
(Decrease)
%
Change
Revenues, net (as adjusted)(1) ............................... $1,398.9 $1,554.5 $(155.6) (10.0%)
U.K. VAT ruling impact on prior years 2005 – 2007(1) ....... — (18.7) 18.7 (100.0%)
Revenues, net of VAT ruling ................................ 1,398.9 1,535.8 (136.9) (8.9%)
Cost of revenues (as adjusted)(1) ............................. 634.3 700.8 (66.5) (9.5%)
U.K. self-employment ruling impact on 2009(1) ............. 4.2 — 4.2 100.0%
U.K. self-employment ruling impact on prior years
2001 – 2008(1) ..................................... 32.5 — 32.5 100.0%
Cost of revenues ......................................... 671.0 700.8 (29.8) (4.3%)
Gross Profit ..................................... 727.9 835.0 (107.1) (12.8%)
Gross Margin % ................................. 52.0% 54.4%
Marketing expenses ....................................... 200.5 227.4 (26.9) (11.8%)
Selling, general & administrative expenses (as adjusted)(1) ........ 165.3 182.6 (17.3) (9.5%)
Impact of restructuring charges .......................... 5.5 — 5.5 100.0%
Selling, general & administrative expenses .................... 170.8 182.6 (11.8) (6.5%)
Operating income ................................ 356.6 425.0 (68.4) (16.1%)
Operating Income Margin % ........................ 25.5% 27.7%
Interest expense .......................................... 66.7 92.7 (26.0) (28.0%)
Other income, net ........................................ (0.2) (2.0) 1.8 (90.0%)
Income before income taxes ........................ 290.1 334.3 (44.2) (13.2%)
Provision for income taxes ................................. 115.6 132.0 (16.4) (12.4%)
Net income ...................................... 174.5 202.3 (27.8) (13.7%)
Net loss attributable to the noncontrolling interest ............... 2.8 2.0 0.8 40.0%
Net income attributable to the Company ............... $ 177.3 $ 204.3 $ (27.0) (13.2%)
Weighted average diluted shares outstanding ................... 77.1 78.5 (1.4) (1.8%)
Diluted EPS ............................................. $ 2.30 $ 2.60 $ (0.30) (11.5%)
(1) “As adjusted” is a non-GAAP financial measure that adjusts the consolidated statements of operations to
exclude from the results of operations for fiscal 2009 the impact of the U.K. self-employment ruling and the
impact of restructuring charges and exclude from the results of operations for fiscal 2008 the impact of the
U.K. VAT ruling pertaining to prior periods. The U.K. VAT ruling impact pertaining specifically to fiscal
2008 of $7.8 million has not been adjusted herein as both years presented include the impact of this ruling.
See “Non-GAAP Financial Measures” above for an explanation of our use of non-GAAP financial
measures.
During the second quarter of fiscal 2008, the Company received a ruling with respect to the imposition of
U.K.VAT on meeting fees collected by our U.K. subsidiary. This ruling resulted in an $18.7 million charge for
periods prior to fiscal 2008 against fiscal 2008 revenues. As the above table shows, when comparing our fiscal
2009 revenues of $1.4 billion to our fiscal 2008 revenues of $1.5 billion, revenues in fiscal 2009 decreased by
8.9% versus the prior year; however, on an adjusted basis, removing the $18.7 million charge from fiscal 2008,
our revenues in fiscal 2009 declined by 10.0% versus fiscal 2008.
The Company received an adverse U.K. tax ruling relating to the self-employment status of its U.K. leaders
in February 2010 which caused the Company to record in fiscal 2009 a prior period charge to expense of $32.5
million and a current period charge of $4.2 million. This tax ruling will impact cost of revenues on an ongoing
38