WeightWatchers 2009 Annual Report Download - page 47
Download and view the complete annual report
Please find page 47 of the 2009 WeightWatchers annual report below. You can navigate through the pages in the report by either clicking on the pages listed below, or by using the keyword search tool below to find specific information within the annual report.-
 1
1 -
2
-
3
-
4
-
5
-
6
-
7
-
8
-
9
-
10
-
11
-
12
-
13
-
14
-
15
-
16
-
17
-
18
-
19
-
20
-
21
-
22
-
23
-
24
-
25
-
26
-
27
-
28
-
29
-
30
-
31
-
32
-
33
-
34
-
35
-
36
-
 37
37 -
 38
38 -
 39
39 -
 40
40 -
 41
41 -
 42
42 -
 43
43 -
 44
44 -
 45
45 -
 46
46 -
 47
47 -
 48
48 -
 49
49 -
 50
50 -
 51
51 -
 52
52 -
 53
53 -
 54
54 -
 55
55 -
 56
56 -
 57
57 -
58
-
59
-
60
-
61
-
62
-
63
-
64
-
65
-
66
-
67
-
68
-
69
-
70
-
71
-
72
-
73
-
74
-
75
-
76
-
77
-
78
-
79
-
80
-
81
-
82
-
83
-
84
-
85
-
86
-
87
-
88
-
89
-
90
-
91
-
92
-
93
-
94
-
95
-
96
-
97
-
98
-
99
-
100
-
101
-
102
-
103
-
104
-
105
-
106
-
107
-
108
-
109
-
110
-
111
-
112
-
113
-
114
-
115
-
116
-
117
-
118
-
119
-
120
 |
 |

Metrics and Business Trends
Global Operations
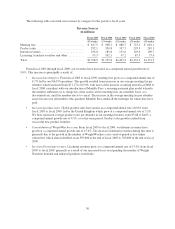
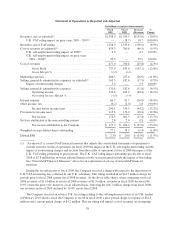
As shown in the chart below, our worldwide annual meeting attendance in our Company-owned operations
(including the previously mentioned acquired franchise operations) has declined from 60.9 million for fiscal
2005 to 54.3 million for fiscal 2009. Our worldwide average revenue per customer, however, has increased over
the same period, largely as a result of Monthly Pass’ growing penetration in NACO and other markets.
Meeting Attendance in Company-Owned Operations
(in millions)
Fiscal 2009 Fiscal 2008 Fiscal 2007 Fiscal 2006 Fiscal 2005
(52 weeks) (53 weeks) (52 weeks) (52 weeks) (52 weeks)
North America ............................... 32.1 36.5 38.1 35.4 33.5
United Kingdom ............................. 11.4 11.6 11.9 11.6 12.6
Continental Europe ........................... 8.6 9.8 10.2 11.1 11.6
Other International ........................... 2.2 2.1 2.5 3.0 3.2
Total ................................... 54.3 60.0 62.7 61.1 60.9
In an effort to provide a greater degree of insight into the drivers of our business, in fiscal 2007 we
introduced a new additional volume metric. This new metric, “paid weeks”, reports total paid weeks by our
customers in Company-owned operations for a given period. For meetings, paid weeks is the sum of total paid
commitment plan weeks and total pay-as-you-go weeks for a given period. For Weight Watchers Online, paid
weeks is the total paid Weight Watchers Online subscriber weeks for a given period. Before the launch of our
commitment plans in the meetings business, our members were largely on a pay-as-you-go basis, and
accordingly, growth in meeting attendance essentially approximated growth in meeting paid weeks. As shown in
the chart below, our worldwide meeting paid weeks grew 27.3% from fiscal 2006 to fiscal 2009, up from
68.8 million in fiscal 2006 to 87.6 million in fiscal 2009. In NACO, where Monthly Pass is highly penetrated,
fiscal 2009 meeting paid weeks of 55.8 million exceeded meeting attendance of 32.1 million by 73.8%.
Paid Weeks in Company-Owned Operations
(in millions)
Fiscal 2009 Fiscal 2008 Fiscal 2007 Fiscal 2006 Fiscal 2005
(52 weeks) (53 weeks) (52 weeks) (52 weeks) (52 weeks)
North America ............................... 55.8 61.0 58.4 42.7 33.5
United Kingdom ............................. 16.2 15.0 12.8 11.6 12.6
Continental Europe ........................... 12.7 12.5 10.7 11.4 11.6
Other International ........................... 2.9 2.8 2.7 3.1 3.2
Total Meeting Paid Weeks ................. 87.6 91.3 84.6 68.8 60.9
Online paid weeks ............................ 42.7 38.9 31.0 25.2 21.4
Total Paid Weeks ......................... 130.3 130.2 115.6 94.0 82.3
North America
Looking historically and at trends, beginning in late 2003, our NACO meeting attendance growth was
adversely affected by increased media exposure to and the resulting popularity of low-carbohydrate diets, which
continued through 2004. Beginning in the third quarter of fiscal 2004 through the first quarter of fiscal 2005, the
declines in NACO meeting attendance excluding the impact of acquisitions versus the prior year periods steadily
improved from minus 16.7% in the second quarter of fiscal 2004 to minus 13.9% in the third quarter of fiscal
2004 to minus 8.7% in the fourth quarter of fiscal 2004 and to minus 5.1% in the first quarter of fiscal 2005.
After that, NACO meeting attendance versus prior year periods, excluding the impact of acquisitions, moved into
positive territory and posted increases of 5.3%, 1.3% and 6.5% in the second, third and fourth quarters of fiscal
2005, respectively. The third quarter of fiscal 2005 grew at a slower pace due to the impact of Hurricane Katrina
and its aftermath, compounded by two subsequent hurricanes. In fiscal 2006, meeting attendance for the full year
31