WeightWatchers 2009 Annual Report Download - page 48
Download and view the complete annual report
Please find page 48 of the 2009 WeightWatchers annual report below. You can navigate through the pages in the report by either clicking on the pages listed below, or by using the keyword search tool below to find specific information within the annual report.-
 1
1 -
2
-
3
-
4
-
5
-
6
-
7
-
8
-
9
-
10
-
11
-
12
-
13
-
14
-
15
-
16
-
17
-
18
-
19
-
20
-
21
-
22
-
23
-
24
-
25
-
26
-
27
-
28
-
29
-
30
-
31
-
32
-
33
-
34
-
35
-
36
-
37
-
 38
38 -
 39
39 -
 40
40 -
 41
41 -
 42
42 -
 43
43 -
 44
44 -
 45
45 -
 46
46 -
 47
47 -
 48
48 -
 49
49 -
 50
50 -
 51
51 -
 52
52 -
 53
53 -
 54
54 -
 55
55 -
 56
56 -
 57
57 -
 58
58 -
59
-
60
-
61
-
62
-
63
-
64
-
65
-
66
-
67
-
68
-
69
-
70
-
71
-
72
-
73
-
74
-
75
-
76
-
77
-
78
-
79
-
80
-
81
-
82
-
83
-
84
-
85
-
86
-
87
-
88
-
89
-
90
-
91
-
92
-
93
-
94
-
95
-
96
-
97
-
98
-
99
-
100
-
101
-
102
-
103
-
104
-
105
-
106
-
107
-
108
-
109
-
110
-
111
-
112
-
113
-
114
-
115
-
116
-
117
-
118
-
119
-
120
 |
 |
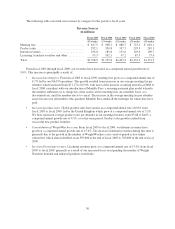
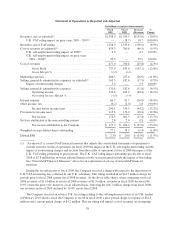
grew at a rate of 5.7%, or 2.9% without the impact of acquisitions. In fiscal 2007, meeting attendance for the full
year grew at a rate of 7.7%, but declined 1.7% without the impact of acquisitions, and paid weeks grew 36.5%,
due largely to the success of our Monthly Pass recurring payment plan.
In fiscal 2008, meeting attendance for the full year declined 4.3% and excluding the impact of acquisitions,
meeting attendance for the full year declined 6.2%, resulting from a number of factors. Rising gasoline and other
consumer prices in mid 2008, and the worsening economic climate in the United States leading to a major
economic recession toward the end of fiscal 2008 coupled with reduced credit availability, adversely impacted
consumer spending. These factors, together with the lack of a meaningful program innovation in NACO for
several years, contributed to the decline in NACO meeting attendance throughout fiscal 2008. Paid weeks in
NACO in fiscal 2008, including the impact of acquisitions, increased 4.5% over the prior year, largely as a result
of increased Monthly Pass penetration. The same factors that began to negatively impact fiscal 2008 continued
into fiscal 2009, with meeting attendance and paid weeks declining 11.8% and 8.4%, respectively. We have seen
the impact of this most acutely in enrollments, particularly in new members, where the decision to spend on any
new products or services is highly scrutinized by consumers in such an environment.
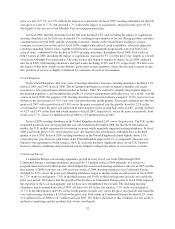
United Kingdom
In the United Kingdom, after four years of meeting attendance increases, meeting attendance declined 3.1%
in fiscal 2005 and 7.4% in fiscal 2006. The declining trend began as a result of negative member and leader
reaction to a new program innovation launched in January 2005. We worked to simplify the program, improve
the meeting experience, and strengthen the quality of our field management and leader force. As a result, over the
course of fiscal 2006, the negative U.K. meeting attendance trend reversed from a negative 17.2% year-over-year
decline in the first quarter, to 7.0% year-over-year growth in the fourth quarter. This trend continued into the first
quarter of 2007 with a growth rate of 9.8% versus the prior year period, but the growth slowed to 2.2% in the
second quarter versus the prior year period and turned negative in the second half of fiscal 2007, posting declines
of 4.2% and 2.4% in the third and fourth quarters of fiscal 2007, respectively, versus the prior year periods. Paid
weeks rose 9.7%, from 11.6 million in fiscal 2006 to 12.8 million in fiscal 2007.
In fiscal 2008, meeting attendance in the United Kingdom declined 2.4% versus the prior year. The U.K. market
responded positively to its new program that was soft-launched in December 2008, but like the North American
market, the U.K. market experienced a worsening economy which negatively impacted meeting attendance. In fiscal
2008, paid weeks grew 17.4% versus the prior year, due largely to the introduction of Monthly Pass in the third
quarter of fiscal 2007. In fiscal 2009, meeting attendance in the United Kingdom declined slightly, down 1.5%,
versus the prior year; however, paid weeks in the United Kingdom improved 8.1% as compared to the prior year.
Similar to the experience in North America, the U.K. economy has had a significant affect on our U.K. business;
however, effective marketing and promotional activity helped to mitigate the affects of a recessionary economy.
Continental Europe
Continental Europe saw meeting attendance growth in every fiscal year from 2000 through 2005.
Continental Europe’s meeting attendance increased by 1.1 million in fiscal 2004 primarily as a result of a
program innovation in the third quarter which helped drive increased meeting attendance into fiscal 2005 and the
first quarter of 2006; however, on a full year basis in fiscal 2006, meeting attendances in Continental Europe
declined by 4.4% versus the prior year. Meeting attendance began to decline in the second quarter of fiscal 2006,
by 7.2% in the second quarter, 7.8% in the third quarter and 10.6% in the fourth quarter, in each case versus the
prior year period. We believe that the growth of the business in Continental Europe prior to fiscal 2006 outpaced
the expertise of the local management, and we have now strengthened these teams. The declining meeting
attendance trend continued into fiscal 2007 (declines of 6.6% in the first quarter, 7.5% in the second quarter,
11.7% in the third quarter and 9.4% in the fourth quarter, in each case versus the prior year period) and ended the
year with meeting attendance 8.5% below the prior year. Paid weeks in Continental Europe declined 6.2%, from
11.4 million in fiscal 2006 to 10.7 million in fiscal 2007. We believe that most of this weakness was the result of
ineffective marketing and the resultant lack of new enrollments.
32