WeightWatchers 2009 Annual Report Download - page 56
Download and view the complete annual report
Please find page 56 of the 2009 WeightWatchers annual report below. You can navigate through the pages in the report by either clicking on the pages listed below, or by using the keyword search tool below to find specific information within the annual report.-
 1
1 -
2
-
3
-
4
-
5
-
6
-
7
-
8
-
9
-
10
-
11
-
12
-
13
-
14
-
15
-
16
-
17
-
18
-
19
-
20
-
21
-
22
-
23
-
24
-
25
-
26
-
27
-
28
-
29
-
30
-
31
-
32
-
33
-
34
-
35
-
36
-
37
-
38
-
39
-
40
-
41
-
42
-
43
-
44
-
45
-
 46
46 -
 47
47 -
 48
48 -
 49
49 -
 50
50 -
 51
51 -
 52
52 -
 53
53 -
 54
54 -
 55
55 -
 56
56 -
 57
57 -
 58
58 -
 59
59 -
 60
60 -
 61
61 -
 62
62 -
 63
63 -
 64
64 -
 65
65 -
 66
66 -
67
-
68
-
69
-
70
-
71
-
72
-
73
-
74
-
75
-
76
-
77
-
78
-
79
-
80
-
81
-
82
-
83
-
84
-
85
-
86
-
87
-
88
-
89
-
90
-
91
-
92
-
93
-
94
-
95
-
96
-
97
-
98
-
99
-
100
-
101
-
102
-
103
-
104
-
105
-
106
-
107
-
108
-
109
-
110
-
111
-
112
-
113
-
114
-
115
-
116
-
117
-
118
-
119
-
120
 |
 |

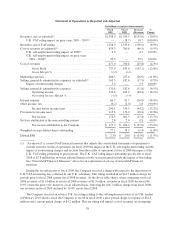
specifically to fiscal 2008 of $7.8 million has not been adjusted herein as both years presented include the
impact of this ruling. See “Non-GAAP Financial Measures” above for an explanation of our use of
non-GAAP financial measures. Set forth below is a reconciliation of gross profit, operating income, net
income attributable to Company and diluted earnings per share to the as reported amounts.
Excluding the charges noted above associated with the U.K. tax rulings in both fiscal years, gross profit of
$764.6 million in fiscal 2009 declined by $89.1 million, or 10.4%, versus $853.7 million in fiscal 2008. Despite a
10.0% decline in revenues, the Company’s adjusted gross margin was 54.7%, down just 20 basis points from
54.9% in fiscal 2008 as a result of our variable cost business model and cost savings initiatives. Adjusted
operating income of $398.8 million in fiscal 2009 declined by $44.9 million, or 10.1%, versus $443.7 million in
fiscal 2008; however, the fiscal 2009 adjusted operating income margin of 28.5% remained unchanged from prior
year, benefiting from lower marketing expenses and selling, general and administrative expense savings.
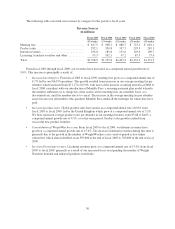
The following table sets forth a reconciliation for fiscal 2009 and fiscal 2008 of certain selected financial
data set forth in the above “Summary of Selected Financial Data as Adjusted” table:
(In millions, except per share
amounts)
Gross
Profit
Operating
Income
Net Income
Attributable
to Company
Diluted
EPS
Fiscal 2009 as Reported .................................... $727.9 $356.6 $177.3 $2.30
Adjustments to Reported Amounts
Impact of restructuring charges ............................ 5.5 3.4 0.04
U.K. self-employment ruling impact on 2009 ................ 32.5 32.5 22.7 0.29
U.K. self-employment ruling impact on prior years
2001—2008 ......................................... 4.2 4.2 2.9 0.04
Total U.K. self-employment ruling impact ............... 36.7 36.7 25.6 0.33
Total Adjustments .............................. 36.7 42.2 29.0 0.38
Fiscal 2009 as Adjusted ..................................... $764.6 $398.8 $206.3 $2.68
Gross
Profit
Operating
Income
Net Income
Attributable
to Company
Diluted
EPS
Fiscal 2008 as Reported .................................... $835.0 $425.0 $204.3 $2.60
Adjustments to Reported Amounts
U.K. VAT ruling impact on prior years 2005—2007 ........... 18.7 18.7 12.7 0.17
Fiscal 2008 as Adjusted ..................................... $853.7 $443.7 $217.0 $2.77
Note: Totals may not sum due to rounding
Components of Revenue and Volumes
The Company’s fiscal year ends on the Saturday closest to December 31st and consists of either 52- or
53-week periods. Fiscal 2009 which began on January 4, 2009 and ended on January 2, 2010 contained 52 weeks,
while fiscal 2008 which began on December 30, 2007 and ended on January 3, 2009 contained 53 weeks. Given
that fiscal 2009 began on January 4, 2009, for comparability, week 1 of fiscal 2008 (December 30, 2007 through
January 5, 2008) was excluded. The excluded extra week in fiscal 2008 contributed globally an additional $15.8
million in net revenues, or 1.0%, and additional operating income of $3.3 million, or 0.8%, to fiscal 2008. The
extra week also contributed globally 0.6 million, or 1.0%, in additional meeting attendances and 1.3 million, or
1.4%, in additional paid weeks.
For the 52 weeks of fiscal 2009 net revenues were $1,398.9 million, a decrease of 8.9%, versus the prior
year of 53 weeks. After adjusting fiscal 2008 revenues for the U.K. VAT ruling, net revenues for fiscal 2009 of
$1,398.9 million, declined $155.6 million, or 10.0%, from $1,554.5 million for fiscal 2008. The largest
40