WeightWatchers 2009 Annual Report Download - page 61
Download and view the complete annual report
Please find page 61 of the 2009 WeightWatchers annual report below. You can navigate through the pages in the report by either clicking on the pages listed below, or by using the keyword search tool below to find specific information within the annual report.-
 1
1 -
2
-
3
-
4
-
5
-
6
-
7
-
8
-
9
-
10
-
11
-
12
-
13
-
14
-
15
-
16
-
17
-
18
-
19
-
20
-
21
-
22
-
23
-
24
-
25
-
26
-
27
-
28
-
29
-
30
-
31
-
32
-
33
-
34
-
35
-
36
-
37
-
38
-
39
-
40
-
41
-
42
-
43
-
44
-
45
-
46
-
47
-
48
-
49
-
50
-
 51
51 -
 52
52 -
 53
53 -
 54
54 -
 55
55 -
 56
56 -
 57
57 -
 58
58 -
 59
59 -
 60
60 -
 61
61 -
 62
62 -
 63
63 -
 64
64 -
 65
65 -
 66
66 -
 67
67 -
 68
68 -
 69
69 -
 70
70 -
 71
71 -
72
-
73
-
74
-
75
-
76
-
77
-
78
-
79
-
80
-
81
-
82
-
83
-
84
-
85
-
86
-
87
-
88
-
89
-
90
-
91
-
92
-
93
-
94
-
95
-
96
-
97
-
98
-
99
-
100
-
101
-
102
-
103
-
104
-
105
-
106
-
107
-
108
-
109
-
110
-
111
-
112
-
113
-
114
-
115
-
116
-
117
-
118
-
119
-
120
 |
 |
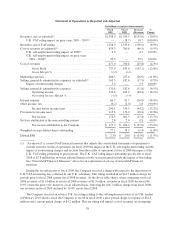
The Company’s fiscal year ends on the Saturday closest to December 31st and consists of either 52- or
53-week periods. Fiscal 2008 contained 53 weeks, while fiscal 2007 contained 52 weeks. The 53rd week in fiscal
2008, which began on December 28, 2008 and ended on January 3, 2009, contributed globally an additional
$13.6 million in net revenues, or 0.9%, and additional operating income of $3.5 million, or 0.8%, to fiscal 2008.
The 53rd week also contributed globally 0.9 million, or 0.7%, in additional paid weeks and 0.4 million, or 0.7%,
in additional attendances, to fiscal 2008. The impact of the 53rd week in fiscal 2008 was primarily attributable to
NACO, as a majority of our international meeting operations were closed during this week for the holiday period.
As noted above, net revenues for fiscal 2008 were $1,535.8 million, an increase of $68.6 million, or 4.7%,
from $1,467.2 million for fiscal 2007. Excluding the full net impact of the U.K. VAT ruling on current and prior
year periods, net revenues of $1,562.3 million in fiscal 2008 increased $95.1 million, or 6.5%, versus fiscal 2007.
The U.K. VAT ruling will negatively impact net revenues on an ongoing basis. Net revenues in fiscal 2008
include a $6.6 million, or 0.4%, benefit from the favorable effects of foreign currency exchange rates. The table
above shows that $7.8 million of the total net charge related to the U.K. VAT ruling pertained specifically to
fiscal 2008. Earned net revenues in fiscal 2008, reduced for this $7.8 million portion of the U.K. VAT charge,
were $1,554.5 million. The U.K. VAT ruling net impact for current and prior years lowered our gross margin and
operating income margins by 70 basis points and 120 basis points, respectively. Excluding this net impact, fiscal
2008 gross margin was 55.1% and operating income margin was 28.9%.
For fiscal 2008, reported global meeting fees were $908.1 million, an increase of $27.4 million, or 3.1%,
from the prior year. Excluding the aggregate net adjustment for the U.K. VAT ruling of $26.5 million, global
meeting fees totaled $934.6 million in fiscal 2008 versus $880.7 million in fiscal 2007, an increase of $53.9
million, or 6.1%, including the favorable impact of foreign currency translation. Global attendance was
60.0 million in fiscal 2008 versus 62.7 million in fiscal 2007, a 2.7 million, or 4.3%, decline. The increase in
global meeting fees is attributable to Monthly Pass. We now have Monthly Pass outside the United States, in the
United Kingdom, Germany, and Australia, each of which launched in the third quarter of 2007, and in France,
which launched during the second quarter of 2008. Monthly Pass drove paid weeks in the global meetings
business to 91.3 million in fiscal 2008, a 7.9% increase versus fiscal 2007, and resulted in a 10.4% increase in the
average meeting fee per attendee on a constant currency basis versus the prior year.
In NACO, meeting fees for fiscal 2008 were $625.3 million, up $21.6 million, or 3.6%, from $603.7 million
for fiscal 2007. Attendance declined 4.3% versus the prior year to 36.5 million including the impact of
acquisitions, and declined 6.2% without the impact of acquisitions. This decline in attendance resulted from a
number of factors. Rising gasoline and other consumer prices, the worsening economic climate and reduced
credit availability adversely affected consumer spending. In fiscal 2008, paid weeks rose 4.5% versus the prior
year as a result of the continued success of Monthly Pass outpacing attendance and thereby driving an 8.2%
increase in the average meeting fee per attendee versus the prior year. In the United States, the third quarter of
fiscal 2008 marked the second anniversary of the launch of Monthly Pass.
Our reported international meeting fees were $282.8 million for fiscal 2008, an increase of $5.8 million, or
2.1%, from fiscal 2007. Excluding the net adjustment for the U.K. VAT ruling, our international meeting fees
were $309.3 million for fiscal 2008, an increase of $32.3 million, or 11.7%, from $277.0 million for fiscal 2007.
On a local currency basis, these adjusted international meeting fees rose 10.4% compared to the prior year. Total
paid weeks in our international meetings business increased 15.4% versus the prior year, with the United
Kingdom up 17.4% and Continental Europe up 16.5%. The introduction of Monthly Pass in the United Kingdom
and Germany in the third quarter of 2007, coupled with a concurrent price increase in the United Kingdom, and
the introduction of Monthly Pass in France in the second quarter of fiscal 2008 drove international meeting fee
revenue growth in fiscal 2008, despite a 4.4% decline in attendance versus the prior year.
Global product sales for fiscal 2008 were $339.8 million, up $2.1 million, or 0.6%, from $337.7 million for
fiscal 2007, driven by an increase in product sales per attendee across all of our markets. A regular strategy of
new product launches, rotation of product offerings, and updating our enrollment products resulted in a trend of
45