US Cellular 2010 Annual Report Download - page 22
Download and view the complete annual report
Please find page 22 of the 2010 US Cellular annual report below. You can navigate through the pages in the report by either clicking on the pages listed below, or by using the keyword search tool below to find specific information within the annual report.-
 1
1 -
2
-
3
-
4
-
5
-
6
-
7
-
8
-
9
-
10
-
11
-
 12
12 -
 13
13 -
 14
14 -
 15
15 -
 16
16 -
 17
17 -
 18
18 -
 19
19 -
 20
20 -
 21
21 -
 22
22 -
 23
23 -
 24
24 -
 25
25 -
 26
26 -
 27
27 -
 28
28 -
 29
29 -
 30
30 -
 31
31 -
 32
32 -
33
-
34
-
35
-
36
-
37
-
38
-
39
-
40
-
41
-
42
-
43
-
44
-
45
-
46
-
47
-
48
-
49
-
50
-
51
-
52
-
53
-
54
-
55
-
56
-
57
-
58
-
59
-
60
-
61
-
62
-
63
-
64
-
65
-
66
-
67
-
68
-
69
-
70
-
71
-
72
-
73
-
74
-
75
-
76
-
77
-
78
-
79
-
80
-
81
-
82
-
83
-
84
-
85
-
86
-
87
-
88
 |
 |
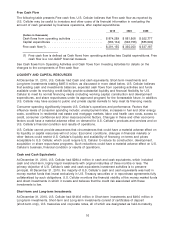
• An $18.8 million decrease in interest payments. Interest payments were $59.0 million and $77.9 million
in 2010 and 2009, respectively.
• Other significant increases in cash flows include Distributions from unconsolidated entities ($9.3 million
increased cash inflow year-over-year) and Changes in customer deposits and deferred revenues
($16.1 million increased cash inflow year-over-year, which includes $7.1 million of deferred revenues
related to loyalty reward points).
Cash flows from operating activities in 2009 were $881.8 million, a decrease of $41.0 million from 2008.
Significant changes included the following:
• Adjusted OIBDA, as shown in the table above, decreased by $88.9 million.
• Changes in accounts receivable, net of bad debts expense, required $6.7 million in 2009 and provided
$4.1 million in 2008, resulting in a $10.8 million decrease in cash flows. This change was driven
primarily by service credit promotions offered to customers in the fourth quarter of 2008.
• Changes in inventory required $36.0 million in 2009 and $15.6 million in 2008. The $20.4 million
decrease in cash flows was attributed to a higher volume of wireless devices on hand as well as the
continued mix shift towards higher-cost premium and smartphone devices.
• Changes in accounts payable, customer deposits and deferred revenues provided $42.7 million in
2009 and $3.2 million in 2008. The resultant $39.5 million increase in cash flows was driven primarily
by timing differences in payments of accounts payable and lower deposit requirements for new
customers in 2009.
• Income tax payments, net of refunds, in 2009 and 2008 were $36.9 million and $116.5 million,
respectively, resulting in an increase in cash flows of $79.6 million. The decrease in payments from
2008 to 2009 was due to a year-over-year decrease in forecasted income and an overpayment of
income taxes in 2008.
• In 2009, a $34.0 million deposit was paid to TDS for U.S. Cellular’s proportionate share of a deposit
TDS made to the IRS. This deposit was recorded in Change in other assets and liabilities in the
Consolidated Statement of Cash Flows in 2009.
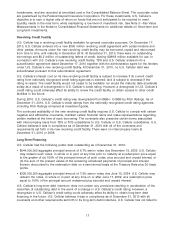
Cash Flows from Investing Activities
U.S. Cellular makes substantial investments to construct and upgrade modern high-quality wireless
communications networks and facilities as a basis for creating long-term value for shareholders. In recent
years, rapid changes in technology and new opportunities have required substantial investments in
potentially revenue-enhancing and cost-reducing upgrades of U.S. Cellular’s networks. Cash flows used
for investing activities also represent cash required for the acquisition of wireless properties or licenses.
Proceeds from exchanges and divestiture transactions have provided funds in recent years which have
partially offset the cash requirements for investing activities; however, such sources cannot be relied
upon to provide continuing or regular sources of financing.
The primary purpose of U.S. Cellular’s construction and expansion expenditures is to provide for
customer and usage growth, to upgrade service and to take advantage of service-enhancing and
cost-reducing technological developments in order to maintain competitive services.
Cash used for property, plant and equipment and system development expenditures totaled
$583.1 million in 2010, $546.8 million in 2009 and $585.6 million in 2008. These expenditures were made
to construct new cell sites, increase capacity in existing cell sites and switches, upgrade technology
including the overlay of 3G technology, develop new and enhance existing office systems, and construct
new and remodel existing retail stores.
14