US Cellular 2010 Annual Report Download - page 14
Download and view the complete annual report
Please find page 14 of the 2010 US Cellular annual report below. You can navigate through the pages in the report by either clicking on the pages listed below, or by using the keyword search tool below to find specific information within the annual report.-
 1
1 -
2
-
3
-
 4
4 -
 5
5 -
 6
6 -
 7
7 -
 8
8 -
 9
9 -
 10
10 -
 11
11 -
 12
12 -
 13
13 -
 14
14 -
 15
15 -
 16
16 -
 17
17 -
 18
18 -
 19
19 -
 20
20 -
 21
21 -
 22
22 -
 23
23 -
 24
24 -
25
-
26
-
27
-
28
-
29
-
30
-
31
-
32
-
33
-
34
-
35
-
36
-
37
-
38
-
39
-
40
-
41
-
42
-
43
-
44
-
45
-
46
-
47
-
48
-
49
-
50
-
51
-
52
-
53
-
54
-
55
-
56
-
57
-
58
-
59
-
60
-
61
-
62
-
63
-
64
-
65
-
66
-
67
-
68
-
69
-
70
-
71
-
72
-
73
-
74
-
75
-
76
-
77
-
78
-
79
-
80
-
81
-
82
-
83
-
84
-
85
-
86
-
87
-
88
 |
 |

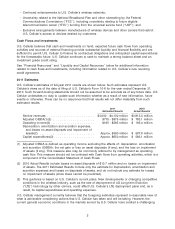
Components of Operating Income
Increase/ Percentage Increase/ Percentage
Year Ended December 31, 2010 (Decrease) Change 2009 (Decrease) Change 2008
(Dollars in thousands)
Retail service ........$3,459,546 $ (18,662) (1)% $3,478,208 $ 39,667 1% $3,438,541
Inbound roaming ..... 253,290 515 — 252,775 (76,421) (23)% 329,196
Other .............. 200,165 4,020 2% 196,145 24,187 14% 171,958
Service revenues .... 3,913,001 (14,127) — 3,927,128 (12,567) — 3,939,695
Equipment sales ...... 264,680 (22,072) (8)% 286,752 (16,107) (5)% 302,859
Total operating
revenues ...... 4,177,681 (36,199) (1)% 4,213,880 (28,674) (1)% 4,242,554
System operations
(excluding
Depreciation,
amortization and
accretion reported
below) ........... 854,931 52,077 6% 802,854 19,788 3% 783,066
Cost of equipment sold . 742,981 (12) — 742,993 (413) — 743,406
Selling, general and
administrative ...... 1,796,624 49,220 3% 1,747,404 40,819 2% 1,706,585
Depreciation,
amortization and
accretion .......... 577,054 7,540 1% 569,514 (7,307) (1)% 576,821
Loss on impairment of
intangible assets .... — (14,000) (100)% 14,000 (372,653) (96)% 386,653
Loss on asset disposals,
net .............. 10,717 (5,452) (34)% 16,169 (1,244) (7)% 17,413
Total operating
expenses ...... 3,982,307 89,373 2% 3,892,934 (321,010) (8)% 4,213,944
Operating income .....$ 195,374 $(125,572) (39)% $ 320,946 $ 292,336 >100% $ 28,610
Operating Revenues
Service revenues
Service revenues consist primarily of: (i) charges for access, airtime, roaming, recovery of regulatory
costs and value-added services, including data products and services, provided to U.S. Cellular’s retail
customers and to end users through third-party resellers (‘‘retail service’’); (ii) charges to other wireless
carriers whose customers use U.S. Cellular’s wireless systems when roaming, including long-distance
roaming (‘‘inbound roaming’’); and (iii) amounts received from the Federal USF.
Retail service revenues
The decrease in Retail service revenues in 2010 was primarily due to a decrease in U.S. Cellular’s
average customer base, partially offset by an increase in the average monthly retail service revenue per
customer. The increase in 2009 was primarily due to an increase in average monthly retail service
revenue per customer.
The average number of customers decreased to 6,121,000 in 2010 from 6,176,000 in 2009, driven by
reductions in postpaid and reseller customers. The average number of customers in 2009 was relatively
flat compared to 2008.
6