US Cellular 2010 Annual Report Download - page 17
Download and view the complete annual report
Please find page 17 of the 2010 US Cellular annual report below. You can navigate through the pages in the report by either clicking on the pages listed below, or by using the keyword search tool below to find specific information within the annual report.-
 1
1 -
2
-
3
-
4
-
5
-
6
-
 7
7 -
 8
8 -
 9
9 -
 10
10 -
 11
11 -
 12
12 -
 13
13 -
 14
14 -
 15
15 -
 16
16 -
 17
17 -
 18
18 -
 19
19 -
 20
20 -
 21
21 -
 22
22 -
 23
23 -
 24
24 -
 25
25 -
 26
26 -
 27
27 -
28
-
29
-
30
-
31
-
32
-
33
-
34
-
35
-
36
-
37
-
38
-
39
-
40
-
41
-
42
-
43
-
44
-
45
-
46
-
47
-
48
-
49
-
50
-
51
-
52
-
53
-
54
-
55
-
56
-
57
-
58
-
59
-
60
-
61
-
62
-
63
-
64
-
65
-
66
-
67
-
68
-
69
-
70
-
71
-
72
-
73
-
74
-
75
-
76
-
77
-
78
-
79
-
80
-
81
-
82
-
83
-
84
-
85
-
86
-
87
-
88
 |
 |
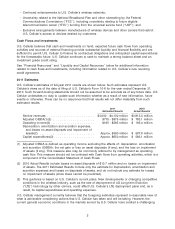
Cost of equipment sold
Cost of equipment sold remained relatively flat in 2010 compared to 2009. A decline in total wireless
devices sold of 5% was offset by a 5% increase in the average cost per wireless device sold due to a
shift in the mix of sales to wireless devices with expanded capabilities, such as smartphones.
Cost of equipment sold remained relatively flat in 2009 compared to 2008. A reduction in the average
cost per wireless device sold, reflecting lower overall purchase costs, was offset by an increase in the
total number of wireless devices sold.
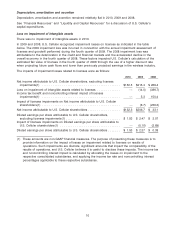
U.S. Cellular’s loss on equipment, defined as equipment sales revenues less cost of equipment sold,
was $478.3 million, $456.2 million and $440.5 million for 2010, 2009 and 2008, respectively. U.S. Cellular
expects loss on equipment to continue to be a significant cost in the foreseeable future as wireless
carriers continue to use device availability and pricing as a means of competitive differentiation. In
addition, U.S. Cellular expects increasing sales of data centric wireless devices such as smartphones
and tablets to result in higher equipment subsidies over time; these devices generally have higher
purchase costs which cannot be recovered through proportionately higher selling prices to customers.
Selling, general and administrative expenses
Selling, general and administrative expenses include salaries, commissions and expenses of field sales
and retail personnel and facilities; telesales department salaries and expenses; agent commissions and
related expenses; corporate marketing and merchandise management; and advertising expenses.
Selling, general and administrative expenses also include bad debts expense, costs of operating
customer care centers and corporate expenses.
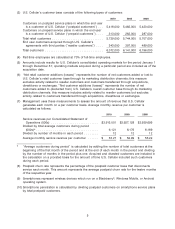
Key components of the net increases in Selling, general and administrative expenses were as follows:
2010—
• Selling and marketing expenses increased by $9.3 million, or 1%, primarily due to higher sales related
expenses and higher advertising expenses due to an increase in media purchases, partially offset by
lower commissions expense reflecting fewer eligible customer additions. In 2010, media purchases
included advertising expenses related to the launch of The Belief Project.
• General and administrative expenses increased $39.9 million, or 4%, due to higher costs related to
investments in multi-year initiatives for business support systems as described in the Overview section;
and higher USF contributions (most of the USF contribution expense is offset by revenues for amounts
passed through to customers). These increases were partially offset by a reduction in bad debts
expense.
2009—
• General and administrative expenses increased $52.4 million, or 6%, primarily due to higher bad debts
expense as a result of higher bad debt write-offs and a change in estimate during the fourth quarter
(as disclosed in Note (4) to Consolidated Quarterly Information (Unaudited) below); higher employee
related expenses; costs of the Battery Swap program; and investments in multi-year initiatives as
described in the Overview section. Partially offsetting these and other increases were lower USF
contributions (most of the USF contribution expenses are offset by revenues for amounts passed
through to customers).
• Advertising expenses decreased $20.9 million, or 8%. Advertising expenses in 2008 included
expenditures related to the launch in June 2008 of a new branding campaign, Believe in Something
BetterSM.
• Other selling and marketing expenses increased by $9.4 million, or 2%, reflecting higher commissions
due to a greater number of retail sales and renewals.
U.S. Cellular expects Selling, general and administrative expenses to increase on a year-over-year basis
driven primarily by increases in expenses associated with acquiring, serving and retaining customers, as
well as costs related to its multi-year initiatives.
9