US Cellular 2010 Annual Report Download - page 21
Download and view the complete annual report
Please find page 21 of the 2010 US Cellular annual report below. You can navigate through the pages in the report by either clicking on the pages listed below, or by using the keyword search tool below to find specific information within the annual report.-
 1
1 -
2
-
3
-
4
-
5
-
6
-
7
-
8
-
9
-
10
-
 11
11 -
 12
12 -
 13
13 -
 14
14 -
 15
15 -
 16
16 -
 17
17 -
 18
18 -
 19
19 -
 20
20 -
 21
21 -
 22
22 -
 23
23 -
 24
24 -
 25
25 -
 26
26 -
 27
27 -
 28
28 -
 29
29 -
 30
30 -
 31
31 -
32
-
33
-
34
-
35
-
36
-
37
-
38
-
39
-
40
-
41
-
42
-
43
-
44
-
45
-
46
-
47
-
48
-
49
-
50
-
51
-
52
-
53
-
54
-
55
-
56
-
57
-
58
-
59
-
60
-
61
-
62
-
63
-
64
-
65
-
66
-
67
-
68
-
69
-
70
-
71
-
72
-
73
-
74
-
75
-
76
-
77
-
78
-
79
-
80
-
81
-
82
-
83
-
84
-
85
-
86
-
87
-
88
 |
 |

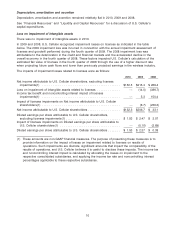
U.S. Cellular’s financial condition and results of operations because it highlights certain key cash and
non-cash items and their impacts on cash flows from operating activities:
2010 2009 2008
(Dollars in thousands)
Operating income .............................. $195,374 $320,946 $ 28,610
Non-cash items
Depreciation, amortization and accretion ............ 577,054 569,514 576,821
Loss on impairment of intangible assets ............. — 14,000 386,653
Loss on asset disposals, net ..................... 10,717 16,169 17,413
Adjusted OIBDA(1) .............................. $783,145 $920,629 $1,009,497
(1) Adjusted OIBDA is defined as operating income excluding the effects of: depreciation,
amortization and accretion (OIBDA); the net gain or loss on asset disposals (if any); and the
loss on impairment of assets (if any). This measure also may be commonly referred to by
management as operating cash flow. This measure should not be confused with Cash flows
from operating activities, which is a component of the Consolidated Statement of Cash Flows.
Adjusted OIBDA excludes the net gain or loss on asset disposals and loss on impairment of
assets (if any), in order to show operating results on a more comparable basis from period to
period. U.S. Cellular does not intend to imply that any of such amounts that are excluded are
non-recurring, infrequent or unusual and, accordingly, they may be incurred in the future.
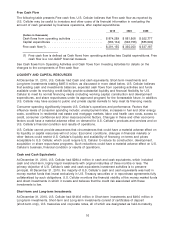
Cash flows from operating activities in 2010 were $874.3 million, a decrease of $7.5 million from 2009.
Significant changes included the following:
• Adjusted OIBDA, as shown in the table above, decreased by $137.5 million primarily due to a
decrease in operating income. See discussion in the ‘‘Results of Operations’’ for factors that affected
operating income.
• Changes in inventory provided $40.3 million in 2010 and required $36.0 million in 2009, resulting in a
$76.3 million year-over-year increase in cash flows. Inventory units on hand were lower in 2010 than
2009 reflecting differences in purchases and actual versus expected sales in the respective periods.
• Changes in accounts payable required $18.6 million in 2010 and provided $52.6 million in 2009
causing a year-over-year decrease in cash flows of $71.2 million. Changes in accounts payable were
driven primarily by payment timing differences.
• A $16.2 million increase in income tax payments. Income tax payments, net of refunds, were
$53.1 million and $36.9 million in 2010 and 2009, respectively.
• The change in Accrued taxes during 2010 includes an outflow of approximately $25 million related to
sales tax payments made during 2010 related to prior years. U.S. Cellular had accrued these sales
taxes at December 31, 2009. The 2009 period does not include a similar outflow related to the
retroactive payment of sales taxes.
• Changes in other assets and liabilities provided $79.5 million in 2010 and required $51.1 million in
2009, resulting in a $130.7 million year-over-year increase in cash flows. In 2009, a $34.0 million
deposit was paid to TDS for U.S. Cellular’s proportionate share of a deposit TDS made to the Internal
Revenue Service (‘‘IRS’’) to eliminate any potential interest due to the IRS subsequent to the date of
the deposit. In 2010, after closure of the IRS audit for the tax years 2002 through 2005, the IRS
returned TDS’ $38.0 million deposit, of which TDS returned $34.0 million to U.S. Cellular, representing
U.S. Cellular’s proportionate share. This $34.0 million was included in Change in other assets and
liabilities in 2010, as a cash inflow, and in 2009, as a cash outflow. This activity resulted in a year-over
year increase in cash flows of $68.0 million from 2009 to 2010. In addition to this $68.0 million change,
changes in prepaid expenses, other current liabilities and amounts due to agents were the primary
cause of the remaining $62.7 million year-over-year change in other assets and liabilities.
13