US Cellular 2010 Annual Report Download - page 20
Download and view the complete annual report
Please find page 20 of the 2010 US Cellular annual report below. You can navigate through the pages in the report by either clicking on the pages listed below, or by using the keyword search tool below to find specific information within the annual report.-
 1
1 -
2
-
3
-
4
-
5
-
6
-
7
-
8
-
9
-
 10
10 -
 11
11 -
 12
12 -
 13
13 -
 14
14 -
 15
15 -
 16
16 -
 17
17 -
 18
18 -
 19
19 -
 20
20 -
 21
21 -
 22
22 -
 23
23 -
 24
24 -
 25
25 -
 26
26 -
 27
27 -
 28
28 -
 29
29 -
 30
30 -
31
-
32
-
33
-
34
-
35
-
36
-
37
-
38
-
39
-
40
-
41
-
42
-
43
-
44
-
45
-
46
-
47
-
48
-
49
-
50
-
51
-
52
-
53
-
54
-
55
-
56
-
57
-
58
-
59
-
60
-
61
-
62
-
63
-
64
-
65
-
66
-
67
-
68
-
69
-
70
-
71
-
72
-
73
-
74
-
75
-
76
-
77
-
78
-
79
-
80
-
81
-
82
-
83
-
84
-
85
-
86
-
87
-
88
 |
 |

Income tax expense
The effective tax rates on Income before income taxes (‘‘pre-tax income’’) for 2010, 2009 and 2008 were
33.8%, 33.7% and 11.4%, respectively. The following significant discrete and other items impacted
income tax expense for these years:
2010—Includes a tax benefit of $7.9 million resulting from favorable settlements of state income tax
audits.
2009—Includes tax benefits of $7.7 million and $7.2 million resulting from a state tax law change and the
release of state valuation allowances, respectively.
2008—Includes tax benefits of $7.6 million and $2.5 million resulting from a change in filing positions in
certain states and the resolution of a prior period tax issue, respectively. The percentage impact of these
benefits was magnified due to the 2008 Loss on impairment of intangible assets of $386.7 million, which
decreased pre-tax income.
See Note 4—Income Taxes in the Notes to Consolidated Financial Statements for a discussion of income
tax expense and the overall effective tax rate on Income before income taxes.
INFLATION
Management believes that inflation affects U.S. Cellular’s business to no greater or lesser extent than the
general economy.
RECENT ACCOUNTING PRONOUNCEMENTS
In general, recent accounting pronouncements did not have and are not expected to have a significant
effect on U.S. Cellular’s financial condition and results of operations.
See Note 1—Summary of Significant Accounting Policies and Recent Accounting Pronouncements in the
Notes to Consolidated Financial Statements for information on recent accounting pronouncements.
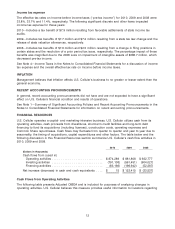
FINANCIAL RESOURCES
U.S. Cellular operates a capital- and marketing-intensive business. U.S. Cellular utilizes cash from its
operating activities, cash proceeds from divestitures, short-term credit facilities and long-term debt
financing to fund its acquisitions (including licenses), construction costs, operating expenses and
Common Share repurchases. Cash flows may fluctuate from quarter to quarter and year to year due to
seasonality, the timing of acquisitions, capital expenditures and other factors. The table below and the
following discussion in this Financial Resources section summarize U.S. Cellular’s cash flow activities in
2010, 2009 and 2008.
2010 2009 2008
(Dollars in thousands)
Cash flows from (used in)
Operating activities ............................ $874,289 $ 881,808 $ 922,777
Investing activities ............................ (791,108) (561,451) (904,027)
Financing activities ............................ (83,166) (196,942) (52,287)
Net increase (decrease) in cash and cash equivalents .... $ 15 $123,415 $ (33,537)
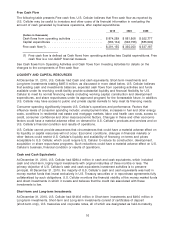
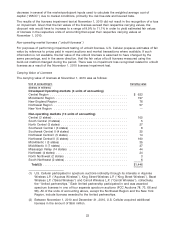
Cash Flows from Operating Activities
The following table presents Adjusted OIBDA and is included for purposes of analyzing changes in
operating activities. U.S. Cellular believes this measure provides useful information to investors regarding
12