US Cellular 2010 Annual Report Download - page 13
Download and view the complete annual report
Please find page 13 of the 2010 US Cellular annual report below. You can navigate through the pages in the report by either clicking on the pages listed below, or by using the keyword search tool below to find specific information within the annual report.
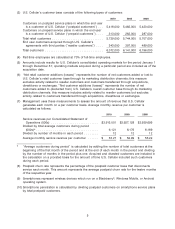
(3) U.S. Cellular’s customer base consists of the following types of customers:
2010 2009 2008
Customers on postpaid service plans in which the end user
is a customer of U.S. Cellular (‘‘postpaid customers’’) . . . 5,416,000 5,482,000 5,420,000
Customers on prepaid service plans in which the end user
is a customer of U.S. Cellular (‘‘prepaid customers’’) .... 313,000 262,000 287,000
Total retail customers ............................ 5,729,000 5,744,000 5,707,000
End user customers acquired through U.S. Cellular’s
agreements with third parties (‘‘reseller customers’’) .... 343,000 397,000 489,000
Total customers ................................ 6,072,000 6,141,000 6,196,000
(4) Part-time employees are calculated at 70% of full-time employees.
(5) Amounts include results for U.S. Cellular’s consolidated operating markets for the period January 1
through December 31; operating markets acquired during a particular period are included as of the
acquisition date.
(6) ‘‘Net retail customer additions (losses)’’ represents the number of net customers added or lost to
U.S. Cellular’s retail customer base through its marketing distribution channels; this measure
excludes activity related to reseller customers and customers transferred through acquisitions,
divestitures or exchanges. ‘‘Net customer additions (losses)’’ represents the number of net
customers added to (deducted from) U.S. Cellular’s overall customer base through its marketing
distribution channels; this measure includes activity related to reseller customers but excludes
activity related to customers transferred through acquisitions, divestitures or exchanges.
(7) Management uses these measurements to assess the amount of revenue that U.S. Cellular
generates each month on a per customer basis. Average monthly revenue per customer is
calculated as follows:
2010 2009 2008
Service revenues per Consolidated Statement of
Operations (000s) .......................... $3,913,001 $3,927,128 $3,939,695
Divided by total average customers during period
(000s)* .................................. 6,121 6,176 6,169
Divided by number of months in each period ........ 12 12 12
Average monthly service revenue per customer ...... $ 53.27 $ 52.99 $ 53.22
* ‘‘Average customers during period’’ is calculated by adding the number of total customers at the
beginning of the first month of the period and at the end of each month in the period and dividing
by the number of months in the period plus one. Acquired and divested customers are included in
the calculation on a prorated basis for the amount of time U.S. Cellular included such customers
during each period.
(8) Postpaid churn rate represents the percentage of the postpaid customer base that disconnects
service each month. This amount represents the average postpaid churn rate for the twelve months
of the respective year.
(9) Smartphones represent wireless devices which run on a Blackberryᓼ, Windows Mobile, or Android
operating system.
(10) Smartphone penetration is calculated by dividing postpaid customers on smartphone service plans
by total postpaid customers.
5


