Tyson Foods 2015 Annual Report Download - page 92
Download and view the complete annual report
Please find page 92 of the 2015 Tyson Foods annual report below. You can navigate through the pages in the report by either clicking on the pages listed below, or by using the keyword search tool below to find specific information within the annual report.-
 1
1 -
2
-
3
-
4
-
5
-
6
-
7
-
8
-
9
-
10
-
11
-
12
-
13
-
14
-
15
-
16
-
17
-
18
-
19
-
20
-
21
-
22
-
23
-
24
-
25
-
26
-
27
-
28
-
29
-
30
-
31
-
32
-
33
-
34
-
35
-
36
-
37
-
38
-
39
-
40
-
41
-
42
-
43
-
44
-
45
-
46
-
47
-
48
-
49
-
50
-
51
-
52
-
53
-
54
-
55
-
56
-
57
-
58
-
59
-
60
-
61
-
62
-
63
-
64
-
65
-
66
-
67
-
68
-
69
-
70
-
71
-
72
-
73
-
74
-
75
-
76
-
77
-
78
-
79
-
80
-
81
-
 82
82 -
 83
83 -
 84
84 -
 85
85 -
 86
86 -
 87
87 -
 88
88 -
 89
89 -
 90
90 -
 91
91 -
 92
92 -
 93
93 -
 94
94 -
 95
95 -
 96
96 -
 97
97 -
 98
98 -
 99
99 -
 100
100 -
 101
101 -
 102
102 -
103
-
104
-
105
-
106
-
107
-
108
-
109
-
110
-
111
-
112
-
113
-
114
-
115
-
116
-
117
-
118
-
119
-
120
-
121
-
122
-
123
-
124
-
125
-
126
-
127
-
128
-
129
-
130
-
131
-
132
-
133
-
134
-
135
-
136
-
137
-
138
-
139
-
140
-
141
-
142
-
143
-
144
-
145
-
146
-
147
-
148
-
149
-
150
-
151
-
152
-
153
-
154
-
155
-
156
-
157
-
158
-
159
-
160
-
161
-
162
-
163
-
164
-
165
-
166
-
167
-
168
-
169
-
170
-
171
-
172
-
173
-
174
 |
 |

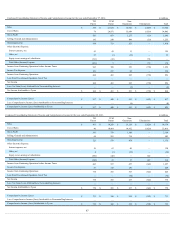
CondensedConsolidatingStatementofCashFlowsfortheyearendedOctober3,2015
inmillions
TFI
Parent
TFM
Parent
Non-
Guarantors
Eliminations
Total
CashProvidedby(Usedfor)OperatingActivities $ 274
$ 476
$ 1,841
$(21)
$ 2,570
CashFlowsfromInvestingActivities:
Additionstoproperty,plantandequipment —
(159)
(695)
—
(854)
(Purchasesof)/Proceedsfrommarketablesecurities,net 21
—
(7)
—
14
Acquisitions,netofcashacquired —
—
—
—
—
Proceedsfromsaleofbusinesses —
—
539
—
539
Other,net 23
1
7
—
31
CashProvidedby(Usedfor)InvestingActivities 44
(158)
(156)
—
(270)
CashFlowsfromFinancingActivities:
Netchangeindebt (1,092)
—
(402)
—
(1,494)
Proceedsfromissuanceofcommonstock,netofissuancecosts —
—
—
—
—
Proceedsfromissuanceofequitycomponentoftangibleequityunits —
—
—
—
—
PurchasesofTysonClassAcommonstock (495)
—
—
—
(495)
Dividends (147)
—
(21)
21
(147)
Stockoptionsexercised 84
—
—
—
84
Other,net 22
—
(5)
—
17
Netchangeinintercompanybalances 1,310
(347)
(963)
—
—
CashProvidedby(Usedfor)FinancingActivities (318)
(347)
(1,391)
21
(2,035)
EffectofExchangeRateChangeonCash —
—
(15)
—
(15)
Increase(Decrease)inCashandCashEquivalents —
(29)
279
—
250
CashandCashEquivalentsatBeginningofYear —
41
397
—
438
CashandCashEquivalentsatEndofPeriod $ —
$ 12
$ 676
$ —
$ 688
CondensedConsolidatingStatementofCashFlowsfortheyearendedSeptember27,2014
inmillions
TFI
Parent
TFM
Parent
Non-
Guarantors
Eliminations
Total
CashProvidedby(Usedfor)OperatingActivities $ 132
$ 431
$ 660
$(45)
$ 1,178
CashFlowsfromInvestingActivities:
Additionstoproperty,plantandequipment (1)
(147)
(484)
—
(632)
(Purchasesof)/Proceedsfrommarketablesecurities,net —
—
15
—
15
Acquisitions,netofcashacquired (8,193)
—
—
—
(8,193)
Proceedsfromsaleofbusinesses —
—
—
—
—
Other,net 5
2
3
—
10
CashProvidedby(Usedfor)InvestingActivities (8,189)
(145)
(466)
—
(8,800)
CashFlowsfromFinancingActivities:
Netchangeindebt 5,154
—
(12)
—
5,142
Proceedsfromissuanceofcommonstock,netofissuancecosts 873
—
—
—
873
Proceedsfromissuanceofequitycomponentoftangibleequityunits 1,255
—
—
—
1,255
PurchasesofTysonClassAcommonstock (295)
—
—
—
(295)
Dividends (104)
—
(45)
45
(104)
Stockoptionsexercised 67
—
—
—
67
Other,net (22)
—
(1)
—
(23)
Netchangeinintercompanybalances 1,129
(266)
(863)
—
—
CashProvidedby(Usedfor)FinancingActivities 8,057
(266)
(921)
45
6,915
EffectofExchangeRateChangeonCash —
—
—
—
—
Increase(Decrease)inCashandCashEquivalents —
20
(727)
—
(707)
CashandCashEquivalentsatBeginningofYear —
21
1,124
—
1,145
CashandCashEquivalentsatEndofPeriod $ —
$ 41
$ 397
$ —
$ 438
90