Tyson Foods 2015 Annual Report Download - page 89
Download and view the complete annual report
Please find page 89 of the 2015 Tyson Foods annual report below. You can navigate through the pages in the report by either clicking on the pages listed below, or by using the keyword search tool below to find specific information within the annual report.-
 1
1 -
2
-
3
-
4
-
5
-
6
-
7
-
8
-
9
-
10
-
11
-
12
-
13
-
14
-
15
-
16
-
17
-
18
-
19
-
20
-
21
-
22
-
23
-
24
-
25
-
26
-
27
-
28
-
29
-
30
-
31
-
32
-
33
-
34
-
35
-
36
-
37
-
38
-
39
-
40
-
41
-
42
-
43
-
44
-
45
-
46
-
47
-
48
-
49
-
50
-
51
-
52
-
53
-
54
-
55
-
56
-
57
-
58
-
59
-
60
-
61
-
62
-
63
-
64
-
65
-
66
-
67
-
68
-
69
-
70
-
71
-
72
-
73
-
74
-
75
-
76
-
77
-
78
-
 79
79 -
 80
80 -
 81
81 -
 82
82 -
 83
83 -
 84
84 -
 85
85 -
 86
86 -
 87
87 -
 88
88 -
 89
89 -
 90
90 -
 91
91 -
 92
92 -
 93
93 -
 94
94 -
 95
95 -
 96
96 -
 97
97 -
 98
98 -
 99
99 -
100
-
101
-
102
-
103
-
104
-
105
-
106
-
107
-
108
-
109
-
110
-
111
-
112
-
113
-
114
-
115
-
116
-
117
-
118
-
119
-
120
-
121
-
122
-
123
-
124
-
125
-
126
-
127
-
128
-
129
-
130
-
131
-
132
-
133
-
134
-
135
-
136
-
137
-
138
-
139
-
140
-
141
-
142
-
143
-
144
-
145
-
146
-
147
-
148
-
149
-
150
-
151
-
152
-
153
-
154
-
155
-
156
-
157
-
158
-
159
-
160
-
161
-
162
-
163
-
164
-
165
-
166
-
167
-
168
-
169
-
170
-
171
-
172
-
173
-
174
 |
 |

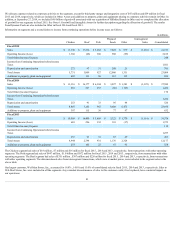
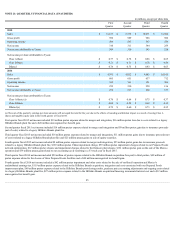
CondensedConsolidatingStatementofIncomeandComprehensiveIncomefortheyearendedSeptember27,2014
inmillions
TFI
Parent
TFM
Parent
Non-
Guarantors
Eliminations
Total
Sales $ 579
$ 21,924
$ 16,926
$(1,849)
$ 37,580
CostofSales 74
20,971
15,689
(1,839)
34,895
GrossProfit 505
953
1,237
(10)
2,685
Selling,GeneralandAdministrative 141
240
884
(10)
1,255
OperatingIncome 364
713
353
—
1,430
Other(Income)Expense:
Interestexpense,net 63
49
13
—
125
Other,net 67
(1)
(13)
—
53
Equityinnetearningsofsubsidiaries (731)
(43)
—
774
—
TotalOther(Income)Expense (601)
5
—
774
178
IncomefromContinuingOperationsbeforeIncomeTaxes 965
708
353
(774)
1,252
IncomeTaxExpense 101
227
68
—
396
IncomefromContinuingOperations 864
481
285
(774)
856
LossfromDiscontinuedOperation,NetofTax —
—
—
—
—
NetIncome 864
481
285
(774)
856
Less:NetGain(Loss)AttributabletoNoncontrollingInterests —
—
(8)
—
(8)
NetIncomeAttributabletoTyson $ 864
$ 481
$ 293
$(774)
$ 864
ComprehensiveIncome(Loss) $ 817
$ 449
$ 243
$(692)
$ 817
Less:ComprehensiveIncome(Loss)AttributabletoNoncontrollingInterests —
—
(8)
—
(8)
ComprehensiveIncome(Loss)AttributabletoTyson $ 817
$ 449
$ 251
$(692)
$ 825
CondensedConsolidatingStatementofIncomeandComprehensiveIncomefortheyearendedSeptember28,2013
inmillions
TFI
Parent
TFM
Parent
Non-
Guarantors
Eliminations
Total
Sales $ 431
$ 19,243
$ 16,120
$(1,420)
$ 34,374
CostofSales 40
18,464
14,932
(1,420)
32,016
GrossProfit 391
779
1,188
—
2,358
Selling,GeneralandAdministrative 68
201
714
—
983
OperatingIncome 323
578
474
—
1,375
Other(Income)Expense:
Interestexpense,net 36
62
40
—
138
Other,net 4
(1)
(23)
—
(20)
Equityinnetearningsofsubsidiaries (582)
(40)
—
622
—
TotalOther(Income)Expense (542)
21
17
622
118
IncomefromContinuingOperationsbeforeIncomeTaxes 865
557
457
(622)
1,257
IncomeTaxExpense 87
172
150
—
409
IncomefromContinuingOperations 778
385
307
(622)
848
LossfromDiscontinuedOperation,NetofTax —
—
(70)
—
(70)
NetIncome 778
385
237
(622)
778
Less:NetGain(Loss)AttributabletoNoncontrollingInterests —
—
—
—
—
NetIncomeAttributabletoTyson $ 778
$ 385
$ 237
$(622)
$ 778
ComprehensiveIncome(Loss) $ 733
$ 380
$ 212
$(592)
$ 733
Less:ComprehensiveIncome(Loss)AttributabletoNoncontrollingInterests —
—
—
—
—
ComprehensiveIncome(Loss)AttributabletoTyson $ 733
$ 380
$ 212
$(592)
$ 733
87