Tyson Foods 2015 Annual Report Download - page 26
Download and view the complete annual report
Please find page 26 of the 2015 Tyson Foods annual report below. You can navigate through the pages in the report by either clicking on the pages listed below, or by using the keyword search tool below to find specific information within the annual report.-
 1
1 -
2
-
3
-
4
-
5
-
6
-
7
-
8
-
9
-
10
-
11
-
12
-
13
-
14
-
15
-
 16
16 -
 17
17 -
 18
18 -
 19
19 -
 20
20 -
 21
21 -
 22
22 -
 23
23 -
 24
24 -
 25
25 -
 26
26 -
 27
27 -
 28
28 -
 29
29 -
 30
30 -
 31
31 -
 32
32 -
 33
33 -
 34
34 -
 35
35 -
 36
36 -
37
-
38
-
39
-
40
-
41
-
42
-
43
-
44
-
45
-
46
-
47
-
48
-
49
-
50
-
51
-
52
-
53
-
54
-
55
-
56
-
57
-
58
-
59
-
60
-
61
-
62
-
63
-
64
-
65
-
66
-
67
-
68
-
69
-
70
-
71
-
72
-
73
-
74
-
75
-
76
-
77
-
78
-
79
-
80
-
81
-
82
-
83
-
84
-
85
-
86
-
87
-
88
-
89
-
90
-
91
-
92
-
93
-
94
-
95
-
96
-
97
-
98
-
99
-
100
-
101
-
102
-
103
-
104
-
105
-
106
-
107
-
108
-
109
-
110
-
111
-
112
-
113
-
114
-
115
-
116
-
117
-
118
-
119
-
120
-
121
-
122
-
123
-
124
-
125
-
126
-
127
-
128
-
129
-
130
-
131
-
132
-
133
-
134
-
135
-
136
-
137
-
138
-
139
-
140
-
141
-
142
-
143
-
144
-
145
-
146
-
147
-
148
-
149
-
150
-
151
-
152
-
153
-
154
-
155
-
156
-
157
-
158
-
159
-
160
-
161
-
162
-
163
-
164
-
165
-
166
-
167
-
168
-
169
-
170
-
171
-
172
-
173
-
174
 |
 |

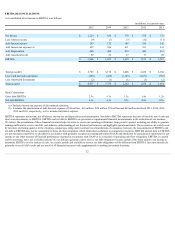
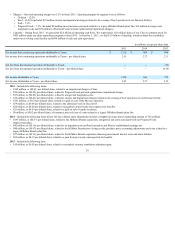
SUMMARY OF RESULTS
Sales inmillions
2015
2014
2013
Sales $ 41,373
$ 37,580
$ 34,374
Changeinsalesvolume 5.0%
2.4%
Changeinaveragesalesprice 4.8%
6.9%
Salesgrowth 10.1%
9.3%
2015 vs. 2014 –
•Sales Volume –Saleswerepositivelyimpactedbyhighersalesvolume,whichaccountedforanincreaseof$2.4billion.TheChickensegmenthadan
increaseinsalesvolumeprimarilyduetoanextraweekinfiscal2015,andthePreparedFoodssegmenthadanincreaseinsalesvolumeprimarilydueto
theacquisitionandconsolidationofHillshireBrandsinourfinalmonthoffiscal2014inadditiontoanextraweekinfiscal2015.Theincreaseinsales
volumewaspartiallyoffsetbyadecreaseintheBeefandPorksegmentsalongwiththedivestituresoftheMexicoandBrazilchickenoperationsinfiscal
2015.
• Average Sales Price –Saleswerepositivelyimpactedbyhigheraveragesalesprices,whichaccountedforanincreaseof$1.4billion.TheBeefand
PreparedFoodssegmentseachhadanincreaseinaveragesalesprices,partiallyoffsetbyadecreaseinaveragesalespricesintheChickenandPork
segments.Theincreaseinaveragesalespricewaslargelyduetocontinuedtightdomesticavailabilityofbeefproductsalongwiththechangeinmixinthe
PreparedFoodssegmentasaresultoftheacquisitionandconsolidationofHillshireBrandsinourfinalmonthoffiscal2014.
2014 vs. 2013 –
•Sales Volume –Saleswerepositivelyimpactedbyanincreaseinsalesvolume,whichaccountedforanincreaseof$679million.Allsegments,withthe
exceptionoftheBeefsegment,hadanincreaseinsalesvolume.PreparedFoodscontributedtothemajorityoftheincreaseduetotheacquisitionand
consolidationofHillshireBrandsinourfinalmonthoffiscal2014.
•Average Sales Price –Saleswerepositivelyimpactedbyhigheraveragesalesprice,whichaccountedforanincreaseofapproximately$2.5billion.Beef,
PorkandPreparedFoodsexperiencedincreasedaveragesalesprice,partiallyoffsetbydecreasedpricinginChicken.Theincreaseinaveragesalesprice
waslargelyduetocontinuedtightdomesticavailabilityofprotein,increasedpricingassociatedwithrisingliveandrawmaterialcosts,andimprovedmix.
ThemajorityoftheincreasewasdrivenbytheBeefandPorksegments.
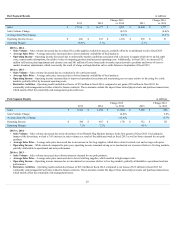
Cost of Sales inmillions
2015
2014
2013
Costofsales $ 37,456
$ 34,895
$ 32,016
Grossprofit 3,917
2,685
2,358
Costofsalesasapercentageofsales 90.5%
92.9%
93.1%
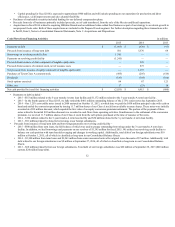
2015 vs. 2014 –
• Costofsalesincreasedbyapproximately$2.6billion.Higherinputcostsperpoundincreasedcostofsalesapproximately$330millionandhighersales
volumeincreasedcostofsalesapproximately$2.3billion.
• Theapproximate$330millionimpactofhigherinputcostswasprimarilydrivenby:
• Increaseinlivecattlecostofapproximately$1.1billionandoperatingcostsofapproximately$90millioninourBeefsegment.
• IncreaseininputcostperpoundrelatedtotheacquisitionofHillshireBrandsonAugust28,2014.
• Increaseof$49millionand$12millionrelatedtoPreparedFoodsnetworkoptimizationimpairmentchargesandDenisonplantimpairmentand
closurecosts,respectively.
• Decreaseinlivehogcostsofapproximately$500millioninourPorksegment.
• Decreaseinrawmaterialandotherinputcostsofapproximately$290millioninourPreparedFoodssegment.
• Decreasesinfeedcostsofapproximately$450millioninourChickensegment.
• Decreaseduetonetunrealizedgainsof$55millioninfiscal2015,comparedtonetunrealizedlossesof$39millioninfiscal2014,fromourBeef
andPorksegmentcommodityriskmanagementactivities.
• The$2.3billionimpactofhighersalesvolumewasdrivenbyanincreaseinsalesvolumeinourChickenandPreparedFoodssegments,partially
offsetbydecreasesinsalesvolumeinourBeefandPorksegments.PreparedFoodscontributedamajorityoftheincreaseduetotheacquisitionof
HillshireBrandsonAugust28,2014,inadditiontotheextraweekinfiscal2015.
25