Tyson Foods 2015 Annual Report Download - page 29
Download and view the complete annual report
Please find page 29 of the 2015 Tyson Foods annual report below. You can navigate through the pages in the report by either clicking on the pages listed below, or by using the keyword search tool below to find specific information within the annual report.-
 1
1 -
2
-
3
-
4
-
5
-
6
-
7
-
8
-
9
-
10
-
11
-
12
-
13
-
14
-
15
-
16
-
17
-
18
-
 19
19 -
 20
20 -
 21
21 -
 22
22 -
 23
23 -
 24
24 -
 25
25 -
 26
26 -
 27
27 -
 28
28 -
 29
29 -
 30
30 -
 31
31 -
 32
32 -
 33
33 -
 34
34 -
 35
35 -
 36
36 -
 37
37 -
 38
38 -
 39
39 -
40
-
41
-
42
-
43
-
44
-
45
-
46
-
47
-
48
-
49
-
50
-
51
-
52
-
53
-
54
-
55
-
56
-
57
-
58
-
59
-
60
-
61
-
62
-
63
-
64
-
65
-
66
-
67
-
68
-
69
-
70
-
71
-
72
-
73
-
74
-
75
-
76
-
77
-
78
-
79
-
80
-
81
-
82
-
83
-
84
-
85
-
86
-
87
-
88
-
89
-
90
-
91
-
92
-
93
-
94
-
95
-
96
-
97
-
98
-
99
-
100
-
101
-
102
-
103
-
104
-
105
-
106
-
107
-
108
-
109
-
110
-
111
-
112
-
113
-
114
-
115
-
116
-
117
-
118
-
119
-
120
-
121
-
122
-
123
-
124
-
125
-
126
-
127
-
128
-
129
-
130
-
131
-
132
-
133
-
134
-
135
-
136
-
137
-
138
-
139
-
140
-
141
-
142
-
143
-
144
-
145
-
146
-
147
-
148
-
149
-
150
-
151
-
152
-
153
-
154
-
155
-
156
-
157
-
158
-
159
-
160
-
161
-
162
-
163
-
164
-
165
-
166
-
167
-
168
-
169
-
170
-
171
-
172
-
173
-
174
 |
 |

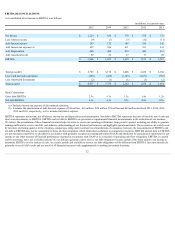
SEGMENT RESULTS
Weoperateinfourreportablesegments:Chicken,Beef,PorkandPreparedFoods.FollowingthesaleofourMexicoandBraziloperationsinfiscal2015,webegan
reportingourinternationaloperationinOther,whichwaspreviouslyreportedastheInternationalsegment.Othernowincludesourforeignchickenproduction
operationsinChinaandIndia,inadditiontothird-partymergerandintegrationcosts.Chicken,Beef,PorkandPreparedFoodsresultswerenotimpactedbythis
change.Allperiodspresentedhavebeenreclassifiedtoreflectthischange.Additionally,theresultsfromDynamicFuels,whichwassoldinfiscal2014,arealso
includedinOtherincomparativeperiods.Thefollowingtableisasummaryofsalesandoperatingincome(loss),whichishowwemeasuresegmentincome(loss).
inmillions
Sales
OperatingIncome(Loss)
2015
2014
2013
2015
2014
2013
Chicken $ 11,390
$ 11,116
$ 10,988
$ 1,366
$ 883
$ 683
Beef 17,236
16,177
14,400
(66)
347
296
Pork 5,262
6,304
5,408
380
455
332
PreparedFoods 7,822
3,927
3,322
588
(60)
101
Other 879
1,381
1,370
(99)
(195)
(37)
IntersegmentSales (1,216)
(1,325)
(1,114)
—
—
—
Total $ 41,373
$ 37,580
$ 34,374
$ 2,169
$ 1,430
$ 1,375
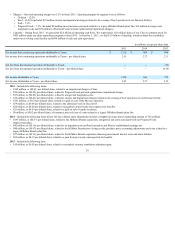
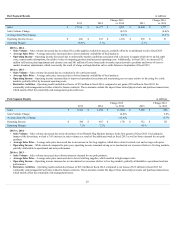
Chicken Segment Results
inmillions
2015
2014
Change2015
vs.2014
2013
Change2014
vs.2013
Sales $ 11,390
$ 11,116
$ 274
$ 10,988
$ 128
SalesVolumeChange
4.2%
2.6%
AverageSalesPriceChange
(1.6)%
(1.4)%
OperatingIncome $ 1,366
$ 883
$ 483
$ 683
$ 200
OperatingMargin 12.0%
7.9%
6.2%
2015 vs. 2014 –
•Sales Volume –Salesvolumegrewasaresultoftheadditionalweekinfiscal2015aswellasstrongerdemandforchickenproductsandmixofrendered
productsales.
•Average Sales Price –Averagesalespricedecreasedasfeedingredientcostsdeclined,partiallyoffsetbymixchanges.
•Operating Income –Operatingincomeincreasedduetohighersalesvolumeandlowerfeedingredientcostsof$450million,partiallyoffsetby
disruptionscausedbyexportbans.
2014 vs. 2013 –
•Sales Volume –Salesvolumegrewasaresultofstrongerdemandforchickenproductsandmixofrenderedproductsales.
•Average Sales Price –Averagesalespricedecreasedasfeedingredientcostsdeclined,partiallyoffsetbymixchanges.
•Operating Income –Operatingincomeincreasedduetohighersalesvolumeandlowerfeedingredientcostsof$600million,partiallyoffsetbydecreased
averagesalesprice.
28