Tyson Foods 2015 Annual Report Download - page 83
Download and view the complete annual report
Please find page 83 of the 2015 Tyson Foods annual report below. You can navigate through the pages in the report by either clicking on the pages listed below, or by using the keyword search tool below to find specific information within the annual report.-
 1
1 -
2
-
3
-
4
-
5
-
6
-
7
-
8
-
9
-
10
-
11
-
12
-
13
-
14
-
15
-
16
-
17
-
18
-
19
-
20
-
21
-
22
-
23
-
24
-
25
-
26
-
27
-
28
-
29
-
30
-
31
-
32
-
33
-
34
-
35
-
36
-
37
-
38
-
39
-
40
-
41
-
42
-
43
-
44
-
45
-
46
-
47
-
48
-
49
-
50
-
51
-
52
-
53
-
54
-
55
-
56
-
57
-
58
-
59
-
60
-
61
-
62
-
63
-
64
-
65
-
66
-
67
-
68
-
69
-
70
-
71
-
72
-
 73
73 -
 74
74 -
 75
75 -
 76
76 -
 77
77 -
 78
78 -
 79
79 -
 80
80 -
 81
81 -
 82
82 -
 83
83 -
 84
84 -
 85
85 -
 86
86 -
 87
87 -
 88
88 -
 89
89 -
 90
90 -
 91
91 -
 92
92 -
 93
93 -
94
-
95
-
96
-
97
-
98
-
99
-
100
-
101
-
102
-
103
-
104
-
105
-
106
-
107
-
108
-
109
-
110
-
111
-
112
-
113
-
114
-
115
-
116
-
117
-
118
-
119
-
120
-
121
-
122
-
123
-
124
-
125
-
126
-
127
-
128
-
129
-
130
-
131
-
132
-
133
-
134
-
135
-
136
-
137
-
138
-
139
-
140
-
141
-
142
-
143
-
144
-
145
-
146
-
147
-
148
-
149
-
150
-
151
-
152
-
153
-
154
-
155
-
156
-
157
-
158
-
159
-
160
-
161
-
162
-
163
-
164
-
165
-
166
-
167
-
168
-
169
-
170
-
171
-
172
-
173
-
174
 |
 |

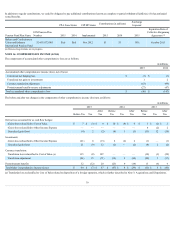
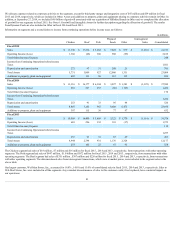
Weallocateexpensesrelatedtocorporateactivitiestothesegments,exceptforthird-partymergerandintegrationcostsof$47millionand$59millioninfiscal
2015and2014,respectively,whichareincludedinOther.Assetsandadditionstoproperty,plantandequipmentrelatingtocorporateactivitiesremaininOther.In
addition,atSeptember27,2014,weincluded$4.8billionofgoodwillassociatedwithouracquisitionofHillshireBrandsinOtherandwecompletedtheallocation
ofgoodwilltooursegmentsinfiscal2015.SeeNote6:GoodwillandIntangibleAssetsforfurtherdescriptionregardingtheallocationofgoodwill.Theresults
fromDynamicFuelsarealsoincludedinOtherinfiscal2014andfiscal2013.
Informationonsegmentsandareconciliationtoincomefromcontinuingoperationsbeforeincometaxesarefollows:
inmillions
Chicken
Beef
Pork
Prepared
Foods
Other
Intersegment
Sales
Consolidated
Fiscal 2015
Sales $ 11,390
$ 17,236
$ 5,262
$ 7,822
$ 879
$ (1,216)
$ 41,373
OperatingIncome(Loss) 1,366
(66)
380
588
(99)
2,169
TotalOther(Income)Expense
248
IncomefromContinuingOperationsbeforeIncome
Taxes
1,921
Depreciationandamortization 272
97
31
280
21
701
TotalAssets 5,731
3,009
927
12,006
1,331
23,004
Additionstoproperty,plantandequipment 405
113
50
167
119
854
Fiscal 2014
Sales $ 11,116
$ 16,177
$ 6,304
$ 3,927
$ 1,381
$ (1,325)
$ 37,580
OperatingIncome(Loss) 883
347
455
(60)
(195)
1,430
TotalOther(Income)Expense
178
IncomefromContinuingOperationsbeforeIncome
Taxes
1,252
Depreciationandamortization 253
91
33
95
48
520
TotalAssets 4,807
3,103
965
8,608
6,473
23,956
Additionstoproperty,plantandequipment 307
115
36
77
97
632
Fiscal 2013
Sales $ 10,988
$ 14,400
$ 5,408
$ 3,322
$ 1,370
$ (1,114)
$ 34,374
OperatingIncome(Loss) 683
296
332
101
(37)
1,375
TotalOther(Income)Expense
118
IncomefromContinuingOperationsbeforeIncome
Taxes
1,257
Depreciationandamortization 253
91
31
67
49
491
TotalAssets 4,944
2,798
931
1,176
2,328
12,177
Additionstoproperty,plantandequipment 253
105
22
87
91
558
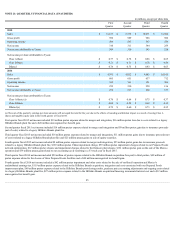
TheChickensegmenthadsalesof$18million,$7millionand$16millionforfiscal2015,2014and2013,respectively,fromtransactionswithotheroperating
segments.ThePorksegmenthadsalesof$847million,$1.0billionand$872millionforfiscal2015,2014and2013,respectively,fromtransactionswithother
operatingsegments.TheBeefsegmenthadsalesof$351million,$307millionand$226millionforfiscal2015,2014and2013,respectively,fromtransactions
withotheroperatingsegments.Theaforementionedsalesfromintersegmenttransactions,whichwereatmarketprices,wereincludedinthesegmentsalesinthe
abovetable.
Ourlargestcustomer,Wal-MartStores,Inc.,accountedfor16.8%,14.6%and13.0%ofconsolidatedsalesinfiscal2015,2014and2013,respectively.Salesto
Wal-MartStores,Inc.wereincludedinallthesegments.Anyextendeddiscontinuanceofsalestothiscustomercould,ifnotreplaced,haveamaterialimpacton
ouroperations.
81