Tyson Foods 2015 Annual Report Download - page 46
Download and view the complete annual report
Please find page 46 of the 2015 Tyson Foods annual report below. You can navigate through the pages in the report by either clicking on the pages listed below, or by using the keyword search tool below to find specific information within the annual report.-
 1
1 -
2
-
3
-
4
-
5
-
6
-
7
-
8
-
9
-
10
-
11
-
12
-
13
-
14
-
15
-
16
-
17
-
18
-
19
-
20
-
21
-
22
-
23
-
24
-
25
-
26
-
27
-
28
-
29
-
30
-
31
-
32
-
33
-
34
-
35
-
 36
36 -
 37
37 -
 38
38 -
 39
39 -
 40
40 -
 41
41 -
 42
42 -
 43
43 -
 44
44 -
 45
45 -
 46
46 -
 47
47 -
 48
48 -
 49
49 -
 50
50 -
 51
51 -
 52
52 -
 53
53 -
 54
54 -
 55
55 -
 56
56 -
57
-
58
-
59
-
60
-
61
-
62
-
63
-
64
-
65
-
66
-
67
-
68
-
69
-
70
-
71
-
72
-
73
-
74
-
75
-
76
-
77
-
78
-
79
-
80
-
81
-
82
-
83
-
84
-
85
-
86
-
87
-
88
-
89
-
90
-
91
-
92
-
93
-
94
-
95
-
96
-
97
-
98
-
99
-
100
-
101
-
102
-
103
-
104
-
105
-
106
-
107
-
108
-
109
-
110
-
111
-
112
-
113
-
114
-
115
-
116
-
117
-
118
-
119
-
120
-
121
-
122
-
123
-
124
-
125
-
126
-
127
-
128
-
129
-
130
-
131
-
132
-
133
-
134
-
135
-
136
-
137
-
138
-
139
-
140
-
141
-
142
-
143
-
144
-
145
-
146
-
147
-
148
-
149
-
150
-
151
-
152
-
153
-
154
-
155
-
156
-
157
-
158
-
159
-
160
-
161
-
162
-
163
-
164
-
165
-
166
-
167
-
168
-
169
-
170
-
171
-
172
-
173
-
174
 |
 |

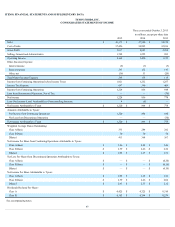
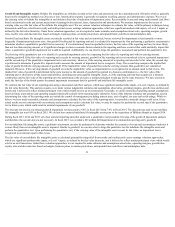
ITEM 8. FINANCIAL STATEMENTS AND SUPPLEMENTARY DATA
TYSON FOODS, INC.
CONSOLIDATED STATEMENTS OF INCOME
ThreeyearsendedOctober3,2015
inmillions,exceptpersharedata
2015
2014
2013
Sales $ 41,373
$ 37,580
$ 34,374
CostofSales 37,456
34,895
32,016
GrossProfit 3,917
2,685
2,358
Selling,GeneralandAdministrative 1,748
1,255
983
OperatingIncome 2,169
1,430
1,375
Other(Income)Expense:
Interestincome (9)
(7)
(7)
Interestexpense 293
132
145
Other,net (36)
53
(20)
TotalOther(Income)Expense 248
178
118
IncomefromContinuingOperationsbeforeIncomeTaxes 1,921
1,252
1,257
IncomeTaxExpense 697
396
409
IncomefromContinuingOperations 1,224
856
848
LossfromDiscontinuedOperation,NetofTax —
—
(70)
NetIncome 1,224
856
778
Less:NetIncome(Loss)AttributabletoNoncontrollingInterests 4
(8)
—
NetIncomeAttributabletoTyson $ 1,220
$ 864
$ 778
AmountsAttributabletoTyson:
NetIncomefromContinuingOperations 1,220
864
848
NetLossfromDiscontinuedOperation —
—
(70)
NetIncomeAttributabletoTyson $ 1,220
$ 864
$ 778
WeightedAverageSharesOutstanding:
ClassABasic 335
284
282
ClassBBasic 70
70
70
Diluted 413
364
367
NetIncomePerSharefromContinuingOperationsAttributabletoTyson:
ClassABasic $ 3.06
$ 2.48
$ 2.46
ClassBBasic $ 2.79
$ 2.26
$ 2.22
Diluted $ 2.95
$ 2.37
$ 2.31
NetLossPerSharefromDiscontinuedOperationAttributabletoTyson:
ClassABasic $ —
$ —
$ (0.20)
ClassBBasic $ —
$ —
$ (0.18)
Diluted $ —
$ —
$ (0.19)
NetIncomePerShareAttributabletoTyson:
ClassABasic $ 3.06
$ 2.48
$ 2.26
ClassBBasic $ 2.79
$ 2.26
$ 2.04
Diluted $ 2.95
$ 2.37
$ 2.12
DividendsDeclaredPerShare:
ClassA $ 0.425
$ 0.325
$ 0.310
ClassB $ 0.383
$ 0.294
$ 0.279
Seeaccompanyingnotes.
45