Tyson Foods 2015 Annual Report Download - page 30
Download and view the complete annual report
Please find page 30 of the 2015 Tyson Foods annual report below. You can navigate through the pages in the report by either clicking on the pages listed below, or by using the keyword search tool below to find specific information within the annual report.-
 1
1 -
2
-
3
-
4
-
5
-
6
-
7
-
8
-
9
-
10
-
11
-
12
-
13
-
14
-
15
-
16
-
17
-
18
-
19
-
 20
20 -
 21
21 -
 22
22 -
 23
23 -
 24
24 -
 25
25 -
 26
26 -
 27
27 -
 28
28 -
 29
29 -
 30
30 -
 31
31 -
 32
32 -
 33
33 -
 34
34 -
 35
35 -
 36
36 -
 37
37 -
 38
38 -
 39
39 -
 40
40 -
41
-
42
-
43
-
44
-
45
-
46
-
47
-
48
-
49
-
50
-
51
-
52
-
53
-
54
-
55
-
56
-
57
-
58
-
59
-
60
-
61
-
62
-
63
-
64
-
65
-
66
-
67
-
68
-
69
-
70
-
71
-
72
-
73
-
74
-
75
-
76
-
77
-
78
-
79
-
80
-
81
-
82
-
83
-
84
-
85
-
86
-
87
-
88
-
89
-
90
-
91
-
92
-
93
-
94
-
95
-
96
-
97
-
98
-
99
-
100
-
101
-
102
-
103
-
104
-
105
-
106
-
107
-
108
-
109
-
110
-
111
-
112
-
113
-
114
-
115
-
116
-
117
-
118
-
119
-
120
-
121
-
122
-
123
-
124
-
125
-
126
-
127
-
128
-
129
-
130
-
131
-
132
-
133
-
134
-
135
-
136
-
137
-
138
-
139
-
140
-
141
-
142
-
143
-
144
-
145
-
146
-
147
-
148
-
149
-
150
-
151
-
152
-
153
-
154
-
155
-
156
-
157
-
158
-
159
-
160
-
161
-
162
-
163
-
164
-
165
-
166
-
167
-
168
-
169
-
170
-
171
-
172
-
173
-
174
 |
 |

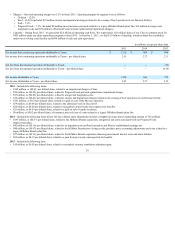
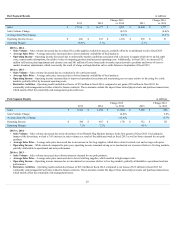
Beef Segment Results
inmillions
2015
2014
Change2015
vs.2014
2013
Change2014
vs.2013
Sales $ 17,236
$ 16,177
$ 1,059
$ 14,400
$ 1,777
SalesVolumeChange
(0.3)%
(0.4)%
AverageSalesPriceChange
6.9%
12.8%
OperatingIncome(Loss) $ (66)
$ 347
$ (413)
$ 296
$ 51
OperatingMargin (0.4)%
2.1%
2.1%
2015 vs. 2014 –
•Sales Volume –Salesvolumedecreasedduetoreducedlivecattlesuppliesavailabletoprocess,partiallyoffsetbyanadditionalweekinfiscal2015.
• Average Sales Price –Averagesalespriceincreasedduetolowerdomesticavailabilityofbeefproducts.
•Operating Income –Operatingincomedecreasedduetounfavorablemarketconditionsassociatedwithadecreaseinsupplywhichdroveupfedcattle
costs,exportmarketdisruptions,therelativevalueofcompetingproteinsandincreasedoperatingcosts.Additionally,infiscal2015,weincurred$12
millioninDenisonplantimpairmentandclosurecostsand$81millionoflossesfrommark-to-marketopenderivativepositionsandlower-of-cost-or-
marketinventoryadjustments,whichwasmostlytheresultofalargeandrapiddeclineinlivecattlefuturesinSeptemberoffiscal2015.
2014 vs. 2013 –
•Sales Volume –Salesvolumedecreasedduetoareductioninlivecattleprocessed.
• Average Sales Price –Averagesalespriceincreasedduetolowerdomesticavailabilityofbeefproducts.
•Operating Income –Operatingincomeincreasedduetoimprovedoperationalexecutionandmaximizingourrevenuesrelativetotherisinglivecattle
markets,partiallyoffsetbyincreasedoperatingcosts.
•Derivative Activities –Operatingresultsincludednetlossesof$72millioninfiscal2014,comparedtonetgainsof$9millioninfiscal2013for
commodityriskmanagementactivitiesrelatedtofuturescontracts.Theseamountsexcludetheimpactfromrelatedphysicalsaleandpurchasetransactions,
whichmostlyoffsetthecommodityriskmanagementgainsandlosses.
Pork Segment Results
inmillions
2015
2014
Change2015
vs.2014
2013
Change2014
vs.2013
Sales $ 5,262
$ 6,304
$ (1,042)
$ 5,408
$ 896
SalesVolumeChange
(0.8)%
0.8%
AverageSalesPriceChange
(15.8)%
15.7%
OperatingIncome $ 380
$ 455
$ (75)
$ 332
$ 123
OperatingMargin 7.2%
7.2%
6.1%
2015 vs. 2014 –
•Sales Volume –SalesvolumedecreasedduetothedivestitureofourHeinoldHogMarketsbusinessinthefirstquarteroffiscal2015.Excludingthe
impactofthedivestiture,wehada5.4%increaseinsalesvolumeasaresultoftheadditionalweekinfiscal2015aswellasbetterdemandforourpork
products.
• Average Sales Price –Averagesalespricedecreasedduetoanincreaseinlivehogsupplies,whichdrovedownlivestockcostandaveragesalesprice.
•Operating Income –Whilereducedcomparedtoprioryear,operatingincomeremainedstrongaswemaximizedourrevenuesrelativetolivehogmarkets,
partiallyattributabletooperationalandmixperformance.
2014 vs. 2013 –
• Sales Volume –Salesvolumeincreasedduetobetterdomesticdemandforourporkproducts.
• Average Sales Price –Averagesalespriceincreasedduetolowertotalhogsupplies,whichresultedinhigherinputcosts.
• Operating Income –Operatingincomeincreasedaswemaximizedourrevenuesrelativetolivehogmarkets,partiallyattributabletooperationalandmix
performance.
• Derivative Activities –Operatingresultsincludednetlossesof$112millioninfiscal2014,comparedtonetlossesof$15millioninfiscal2013for
commodityriskmanagementactivitiesrelatedtofuturescontracts.Theseamountsexcludetheimpactfromrelatedphysicalsaleandpurchasetransactions,
whichmostlyoffsetthecommodityriskmanagementlosses.
29