Tyson Foods 2015 Annual Report Download - page 32
Download and view the complete annual report
Please find page 32 of the 2015 Tyson Foods annual report below. You can navigate through the pages in the report by either clicking on the pages listed below, or by using the keyword search tool below to find specific information within the annual report.-
 1
1 -
2
-
3
-
4
-
5
-
6
-
7
-
8
-
9
-
10
-
11
-
12
-
13
-
14
-
15
-
16
-
17
-
18
-
19
-
20
-
21
-
 22
22 -
 23
23 -
 24
24 -
 25
25 -
 26
26 -
 27
27 -
 28
28 -
 29
29 -
 30
30 -
 31
31 -
 32
32 -
 33
33 -
 34
34 -
 35
35 -
 36
36 -
 37
37 -
 38
38 -
 39
39 -
 40
40 -
 41
41 -
 42
42 -
43
-
44
-
45
-
46
-
47
-
48
-
49
-
50
-
51
-
52
-
53
-
54
-
55
-
56
-
57
-
58
-
59
-
60
-
61
-
62
-
63
-
64
-
65
-
66
-
67
-
68
-
69
-
70
-
71
-
72
-
73
-
74
-
75
-
76
-
77
-
78
-
79
-
80
-
81
-
82
-
83
-
84
-
85
-
86
-
87
-
88
-
89
-
90
-
91
-
92
-
93
-
94
-
95
-
96
-
97
-
98
-
99
-
100
-
101
-
102
-
103
-
104
-
105
-
106
-
107
-
108
-
109
-
110
-
111
-
112
-
113
-
114
-
115
-
116
-
117
-
118
-
119
-
120
-
121
-
122
-
123
-
124
-
125
-
126
-
127
-
128
-
129
-
130
-
131
-
132
-
133
-
134
-
135
-
136
-
137
-
138
-
139
-
140
-
141
-
142
-
143
-
144
-
145
-
146
-
147
-
148
-
149
-
150
-
151
-
152
-
153
-
154
-
155
-
156
-
157
-
158
-
159
-
160
-
161
-
162
-
163
-
164
-
165
-
166
-
167
-
168
-
169
-
170
-
171
-
172
-
173
-
174
 |
 |

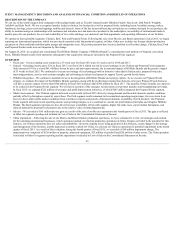
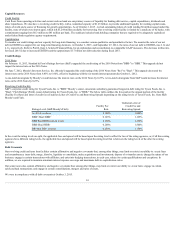
LIQUIDITY AND CAPITAL RESOURCES
Ourcashneedsforworkingcapital,capitalexpenditures,growthopportunities,therepurchasesofseniornotes,repaymentoftermloansandsharerepurchasesare
expectedtobemetwithcurrentcashonhand,cashflowsprovidedbyoperatingactivities,orshort-termborrowings.Basedonourcurrentexpectations,webelieve
ourliquidityandcapitalresourceswillbesufficienttooperateourbusiness.However,wemaytakeadvantageofopportunitiestogenerateadditionalliquidityor
refinanceexistingdebtthroughcapitalmarkettransactions.Theamount,natureandtimingofanycapitalmarkettransactionswilldependonouroperating
performanceandothercircumstances;ourthen-currentcommitmentsandobligations;theamount,natureandtimingofourcapitalrequirements;anylimitations
imposedbyourcurrentcreditarrangements;andoverallmarketconditions.
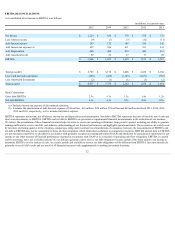
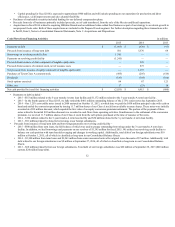
Cash Flows from Operating Activities
inmillions
2015
2014
2013
Netincome $ 1,224
$ 856
$ 778
Non-cashitemsinnetincome:
Depreciationandamortization 711
530
519
Deferredincometaxes 38
(105)
(12)
Convertibledebtdiscount —
(92)
—
Gainondispositionsofbusinesses (177)
—
—
Impairmentofassets 285
107
74
Stock-basedcompensationexpense 69
51
36
Other,net 71
(20)
(10)
Netchangesinoperatingassetsandliabilities 349
(149)
(71)
Netcashprovidedbyoperatingactivities $ 2,570
$ 1,178
$ 1,314
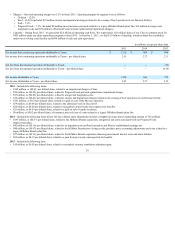
• OperatingcashoutflowassociatedwiththeConvertibledebtdiscountrelatedtotheinitialdebtdiscountof$92milliononour3.25%convertiblenotes
issuedin2008,whichmaturedonOctober15,2013,andwereretiredinfiscal2014.
• Impairmentofassetsinfiscal2015included$59millionofimpairmentchargesrelatedtoourPreparedFoodsnetworkoptimizationand$169millionof
impairmentsrelatedtoourChinaoperation.ForfurtherdescriptionregardingthesechargesrefertoPartII,Item8,NotestoConsolidatedFinancial
Statements,Note3:AcquisitionsandDispositionsandNote10:OtherIncomeandCharges.
• Other,netincreaseinfiscal2015isprimarilydrivenbynon-cashpensionexpense.
• Cashflowsassociatedwithchangesinoperatingassetsandliabilities:
•2015 – Increasedprimarilyduetothedecreaseininventoryandaccountsreceivablebalancesandanincreaseintaxespayable,partiallyoffsetbythe
decreaseinaccountspayable.Thedecreasedinventory,accountsreceivableandaccountspayablebalanceswerelargelyduetodecreasedrawmaterial
costsandtimingofsalesandpayments.
• 2014 – Decreasedprimarilyduetotheincreaseininventoryandaccountsreceivablebalancesanddecreaseinincometaxespayable,partiallyoffsetby
theincreaseinaccountspayable.Thehigherinventory,accountsreceivableandaccountspayablebalancesareprimarilyattributabletosignificant
increasesininputcostsandpriceincreasesassociatedwiththeincreasedinputcosts.
• 2013 – Decreasedprimarilyduetoahigheraccountsreceivablebalance,partiallyoffsetbyincreasesinaccruedsalaries,wagesandbenefitsand
incometaxpayable.Thehigheraccountsreceivablebalanceislargelyduetosignificantincreasesininputcostsandpriceincreasesassociatedwiththe
increasedinputcosts.
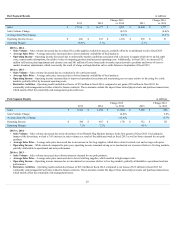
Cash Flows from Investing Activities
inmillions
2015
2014
2013
Additionstoproperty,plantandequipment $ (854)
$ (632)
$ (558)
(Purchasesof)/Proceedsfrommarketablesecurities,net 14
15
(18)
Acquisitions,netofcashacquired —
(8,193)
(106)
Proceedsfromsaleofbusinesses 539
—
—
Other,net 31
10
39
Netcashusedforinvestingactivities $ (270)
$ (8,800)
$ (643)
• Additionstoproperty,plantandequipmentincludedacquiringnewequipmentandupgradingourfacilitiestomaintaincompetitivestandingandposition
usforfutureopportunities.
31