Tyson Foods 2015 Annual Report Download - page 21
Download and view the complete annual report
Please find page 21 of the 2015 Tyson Foods annual report below. You can navigate through the pages in the report by either clicking on the pages listed below, or by using the keyword search tool below to find specific information within the annual report.-
 1
1 -
2
-
3
-
4
-
5
-
6
-
7
-
8
-
9
-
10
-
 11
11 -
 12
12 -
 13
13 -
 14
14 -
 15
15 -
 16
16 -
 17
17 -
 18
18 -
 19
19 -
 20
20 -
 21
21 -
 22
22 -
 23
23 -
 24
24 -
 25
25 -
 26
26 -
 27
27 -
 28
28 -
 29
29 -
 30
30 -
 31
31 -
32
-
33
-
34
-
35
-
36
-
37
-
38
-
39
-
40
-
41
-
42
-
43
-
44
-
45
-
46
-
47
-
48
-
49
-
50
-
51
-
52
-
53
-
54
-
55
-
56
-
57
-
58
-
59
-
60
-
61
-
62
-
63
-
64
-
65
-
66
-
67
-
68
-
69
-
70
-
71
-
72
-
73
-
74
-
75
-
76
-
77
-
78
-
79
-
80
-
81
-
82
-
83
-
84
-
85
-
86
-
87
-
88
-
89
-
90
-
91
-
92
-
93
-
94
-
95
-
96
-
97
-
98
-
99
-
100
-
101
-
102
-
103
-
104
-
105
-
106
-
107
-
108
-
109
-
110
-
111
-
112
-
113
-
114
-
115
-
116
-
117
-
118
-
119
-
120
-
121
-
122
-
123
-
124
-
125
-
126
-
127
-
128
-
129
-
130
-
131
-
132
-
133
-
134
-
135
-
136
-
137
-
138
-
139
-
140
-
141
-
142
-
143
-
144
-
145
-
146
-
147
-
148
-
149
-
150
-
151
-
152
-
153
-
154
-
155
-
156
-
157
-
158
-
159
-
160
-
161
-
162
-
163
-
164
-
165
-
166
-
167
-
168
-
169
-
170
-
171
-
172
-
173
-
174
 |
 |

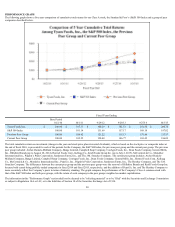
PERFORMANCE GRAPH
Thefollowinggraphshowsafive-yearcomparisonofcumulativetotalreturnsforourClassAstock,theStandard&Poor’s(S&P)500Indexandagroupofpeer
companiesdescribedbelow.
FiscalYearsEnding
BasePeriod
10/2/10
10/1/11
9/29/12
9/28/13
9/27/14
10/3/15
TysonFoods,Inc. $ 100.00
$ 107.73
$ 100.29
$ 181.53
$ 241.50
$ 286.76
S&P500Index 100.00
101.14
131.69
157.17
188.18
187.02
PreviousPeerGroup 100.00
106.42
125.22
155.13
178.46
213.97
CurrentPeerGroup 100.00
102.25
120.48
146.77
169.42
186.09
Thetotalcumulativereturnoninvestment(changeintheyear-endstockpriceplusreinvesteddividends),whichisbasedonthestockpriceorcompositeindexat
theendoffiscal2010,ispresentedforeachoftheperiodsfortheCompany,theS&P500Index,thepreviouspeergroupandthecurrentpeergroup.Theprevious
peergroupincluded:Archer-Daniels-MidlandCompany,BungeLimited,CampbellSoupCompany,ConAgraFoods,Inc.,DeanFoodsCompany,GeneralMills,
Inc.,HillshireBrands(uptoAugust28,2014),HormelFoodsCorp.,KelloggCo.,KraftFoodsGroupInc.(uptoJuly2,2015),McCormick&Co.,Mondelez
InterenationalInc.,Pilgrim’sPrideCorporation,SandersonFarms,Inc.,andTheJ.M.SmuckerCompany.Thecurrentpeergroupincludes:Archer-Daniels-
MidlandCompany,BungeLimited,CampbellSoupCompany,ConAgraFoods,Inc.,DeanFoodsCompany,GeneralMills,Inc.,HormelFoodsCorp.,Kellogg
Co.,McCormick&Co.,MondelezInterenationalInc.,PepsiCo,Inc.,Pilgrim'sPrideCorporation,SandersonFarms,Inc.,TheHersheyCompany,andTheJ.M.
SmuckerCompany.ThedifferencesbetweenthecurrentpeergroupandthepreviouspeergroupweretheremovalofHillshireBrandsandKraftFoodsGroupInc.
becausebothceasedbeingpubliclytradedcompaniesinfiscal2014andfiscal2015,respectively,andtheadditionofPepsiCo,Inc.andTheHersheyCompanyto
moreaccuratelyreflecttheCompany’speersintermsofindustrystanding.ThegraphcomparestheperformanceoftheCompany'sClassAcommonstockwith
thatoftheS&P500Indexandbothpeergroups,withthereturnofeachcompanyinthepeergroupsweightedonmarketcapitalization.
Theinformationinthis"PerformanceGraph"sectionshallnotbedeemedtobe"solicitingmaterial"ortobe"filed"withtheSecuritiesandExchangeCommission
orsubjecttoRegulation14Aor14C,ortotheliabilitiesofSection18oftheSecuritiesExchangeActof1934.
20