Tyson Foods 2015 Annual Report Download - page 27
Download and view the complete annual report
Please find page 27 of the 2015 Tyson Foods annual report below. You can navigate through the pages in the report by either clicking on the pages listed below, or by using the keyword search tool below to find specific information within the annual report.-
 1
1 -
2
-
3
-
4
-
5
-
6
-
7
-
8
-
9
-
10
-
11
-
12
-
13
-
14
-
15
-
16
-
 17
17 -
 18
18 -
 19
19 -
 20
20 -
 21
21 -
 22
22 -
 23
23 -
 24
24 -
 25
25 -
 26
26 -
 27
27 -
 28
28 -
 29
29 -
 30
30 -
 31
31 -
 32
32 -
 33
33 -
 34
34 -
 35
35 -
 36
36 -
 37
37 -
38
-
39
-
40
-
41
-
42
-
43
-
44
-
45
-
46
-
47
-
48
-
49
-
50
-
51
-
52
-
53
-
54
-
55
-
56
-
57
-
58
-
59
-
60
-
61
-
62
-
63
-
64
-
65
-
66
-
67
-
68
-
69
-
70
-
71
-
72
-
73
-
74
-
75
-
76
-
77
-
78
-
79
-
80
-
81
-
82
-
83
-
84
-
85
-
86
-
87
-
88
-
89
-
90
-
91
-
92
-
93
-
94
-
95
-
96
-
97
-
98
-
99
-
100
-
101
-
102
-
103
-
104
-
105
-
106
-
107
-
108
-
109
-
110
-
111
-
112
-
113
-
114
-
115
-
116
-
117
-
118
-
119
-
120
-
121
-
122
-
123
-
124
-
125
-
126
-
127
-
128
-
129
-
130
-
131
-
132
-
133
-
134
-
135
-
136
-
137
-
138
-
139
-
140
-
141
-
142
-
143
-
144
-
145
-
146
-
147
-
148
-
149
-
150
-
151
-
152
-
153
-
154
-
155
-
156
-
157
-
158
-
159
-
160
-
161
-
162
-
163
-
164
-
165
-
166
-
167
-
168
-
169
-
170
-
171
-
172
-
173
-
174
 |
 |

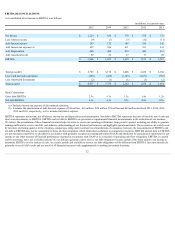
2014 vs. 2013 –
• Costofsalesincreasedbyapproximately$2.9billion.Higherinputcostsperpoundincreasedcostofsales$2.3billionandhighersalesvolumeincreased
costofsales$610million.
• The$2.3billionimpactofhigherinputcostswasprimarilydrivenby:
• Increaseinlivecattleandlivehogcostsofapproximately$1.7billionand$550million,respectively.
• IncreaseinrawmaterialandotherinputcostsinourPreparedFoodssegmentofapproximately$210million.
• Increaseduetonetlossesof$260millioninfiscal2014,comparedtonetgainsofapproximately$5millioninfiscal2013,fromourBeefand
Porksegmentcommodityriskmanagementactivities.Theseamountsexcludetheimpactfromrelatedphysicalpurchasetransactions,which
mostlyoffsetthelosses.
• Decreaseinfeedcostsof$600millioninourChickensegment.
• The$610millionimpactofhighersalesvolumewasdrivenbyincreasesinallofoursegments,withtheexceptionofBeef.ChickenandPrepared
Foodscontributedtothemajorityoftheincrease,withthePreparedFoodsincreasemainlyattributabletotheacquisitionandconsolidationofHillshire
Brandsinourfinalmonthoffiscal2014.
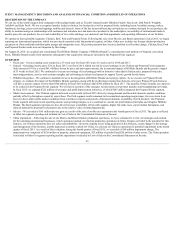
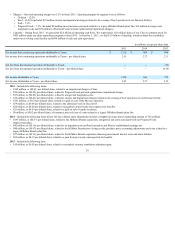
Selling, General and Administrative inmillions
2015
2014
2013
Selling,generalandadministrative $ 1,748
$ 1,255
$ 983
Asapercentageofsales 4.2%
3.3%
2.9%
2015 vs. 2014 –
• Increaseof$493millioninselling,generalandadministrativewasprimarilydrivenby:
• Increaseof$487millionrelatedtotheinclusionofHillshireBrandsinfiscal2015resultswithonlyonemonthinfiscal2014results.
• Increaseof$69millionrelatedtoincrementalamortizationassociatedwiththeacquiredHillshireBrands'intangibles.
• Increaseof$27millionrelatedtoemployeecostsincludingpayrollandstock-basedcompensation.
• Decreaseof$59millionrelatedtoadvertisingandsalespromotionsinthelegacyTysonbusinessprimarilyattributabletodiscontinuingcertain
programsthatwerepresentinfiscal2014.
• Decreaseof$14millionrelatedtomergerandintegrationcostsandemployeeseveranceandretentioncostsassociatedwiththeHillshireBrands
acquisitionandimplementationofourPreparedFoodsstrategy.
•Decreaseof$17millioninallotherprimarilyrelatedtoprofessionalfees.
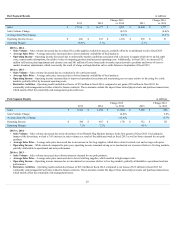
2014 vs. 2013 –
• Increaseof$272millioninselling,generalandadministrativewasprimarilydrivenby:
• Increaseof$71millionrelatedtoemployeecostsincludingpayrollandstock-basedandincentive-basedcompensation,ofwhich$19million
relatedtoemployeeseveranceandretentioncostsassociatedwiththeHillshireBrandsacquisitionandimplementationofourPreparedFoods
strategy.
• Increaseof$32millionrelatedtoadvertisingandsalespromotions.
• Increaseof$82millionrelatedtoprofessionalfees,ofwhich$52millionrelatedtotheHillshireBrandsacquisitionandintegrationcosts.
• Increasesof$17millionininformationtechnologycosts,$7millionincharitablecontributionsanddonationsand$5millionincommissions.
• Increaseof$50millionrelatedtotheHillshireBrandsselling,generalandadministrativepost-closingexpensesinourfinalmonthoffiscal2014.
Interest Income inmillions
2015
2014
2013
$(9)
$(7)
$(7)
2015/2014/2013 –Interestincomeremainedrelativelyflatduetocontinuedlowinterestrates.
26