TCF Bank 2011 Annual Report Download - page 97
Download and view the complete annual report
Please find page 97 of the 2011 TCF Bank annual report below. You can navigate through the pages in the report by either clicking on the pages listed below, or by using the keyword search tool below to find specific information within the annual report.-
 1
1 -
2
-
3
-
4
-
5
-
6
-
7
-
8
-
9
-
10
-
11
-
12
-
13
-
14
-
15
-
16
-
17
-
18
-
19
-
20
-
21
-
22
-
23
-
24
-
25
-
26
-
27
-
28
-
29
-
30
-
31
-
32
-
33
-
34
-
35
-
36
-
37
-
38
-
39
-
40
-
41
-
42
-
43
-
44
-
45
-
46
-
47
-
48
-
49
-
50
-
51
-
52
-
53
-
54
-
55
-
56
-
57
-
58
-
59
-
60
-
61
-
62
-
63
-
64
-
65
-
66
-
67
-
68
-
69
-
70
-
71
-
72
-
73
-
74
-
75
-
76
-
77
-
78
-
79
-
80
-
81
-
82
-
83
-
84
-
85
-
86
-
 87
87 -
 88
88 -
 89
89 -
 90
90 -
 91
91 -
 92
92 -
 93
93 -
 94
94 -
 95
95 -
 96
96 -
 97
97 -
 98
98 -
 99
99 -
 100
100 -
 101
101 -
 102
102 -
 103
103 -
 104
104 -
 105
105 -
 106
106 -
 107
107 -
108
-
109
-
110
-
111
-
112
-
113
-
114
-
115
-
116
-
117
-
118
-
119
-
120
-
121
-
122
-
123
-
124
-
125
-
126
-
127
-
128
-
129
-
130
-
131
-
132
-
133
-
134
-
135
-
136
-
137
-
138
-
139
-
140
 |
 |

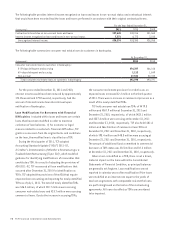
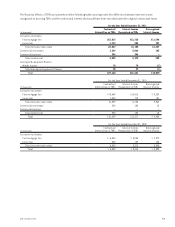
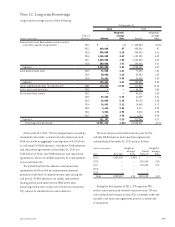
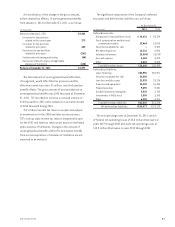
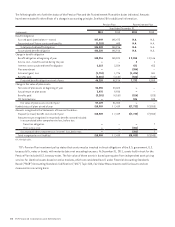
Note 12. Long-term Borrowings
Long-term borrowings consist of the following.
At December 31,
2011 2010
(Dollars in thousands)
Year of
Maturity Amount
Weighted-
average
Rate Amount
Weighted-
average
Rate
Federal Home Loan Bank advances and securities
sold under repurchase agreements 2011 $ – – % $ 300,000 4.64%
2013 400,000 .97 400,000 .97
2015 900,000 4.18 900,000 4.18
2016 1,100,000 4.49 1,100,000 4.49
2017 1,250,000 4.60 1,250,000 4.60
2018 300,000 3.51 300,000 3.51
Subtotal 3,950,000 4.02 4,250,000 4.07
Subordinated bank notes 2014 71,020 2.21 71,020 1.96
2015 50,000 2.14 50,000 1.89
2016 74,661 5.63 74,589 5.63
Subtotal 195,681 3.49 195,609 3.34
Junior subordinated notes (trust preferred) 2068 114,236 12.83 111,061 12.28
Senior unsecured term note 2012 – – 89,787 3.83
Discounted lease rentals 2011 – – 84,101 5.30
2012 57,622 5.32 61,829 5.31
2013 36,009 5.28 39,155 5.28
2014 16,641 5.12 16,463 5.12
2015 5,662 5.04 5,211 5.02
2016 4,026 4.98 3,818 4.98
2017 1,787 4.98 1,787 4.98
Subtotal 121,747 5.25 212,364 5.27
Total long-term borrowings $4,381,664 4.26% $4,858,821 4.27%
At December 31, 2011, TCF has pledged loans secured by
residential real estate, commercial real estate loans and
FHLB stock with an aggregate carrying value of $6.9 billion
as collateral for FHLB advances. Included in FHLB advances
and repurchase agreements at December 31, 2011 are
$300 million of fixed-rate FHLB advances and repurchase
agreements, which are callable quarterly by counterparties
at par until maturity.
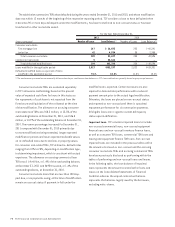
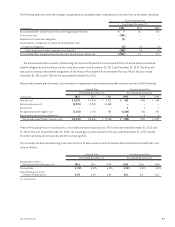
The probability that the advances and repurchase
agreements will be called by counterparties depends
primarily on the level of related interest rates during the
call period. If FHLB advances are called, replacement
funding will be available from the FHLB at the then-
prevailing market rate of interest for the term selected by
TCF, subject to standard terms and conditions.
The next call year and stated maturity year for the
callable FHLB advances and repurchase agreements
outstanding at December 31, 2011 were as follows.
(Dollars in thousands)
Year Next Call
Weighted-
average
Rate
Stated
Maturity
Weighted-
average
Rate
2012 $300,000 4.04% $ – – %
2015 – – 200,000 3.88
2017 – – 100,000 4.37
2018 – – – –
2019 – – – –
Total $300,000 4.04 $300,000 4.04
During the first quarter of 2011, TCF repaid its $90
million senior unsecured variable-rate term note. TCF was
not in default with respect to any of its covenants under the
variable-rate term note agreement prior to or at the time
of repayment.
792011 Form 10-K