TCF Bank 2011 Annual Report Download - page 121
Download and view the complete annual report
Please find page 121 of the 2011 TCF Bank annual report below. You can navigate through the pages in the report by either clicking on the pages listed below, or by using the keyword search tool below to find specific information within the annual report.-
 1
1 -
2
-
3
-
4
-
5
-
6
-
7
-
8
-
9
-
10
-
11
-
12
-
13
-
14
-
15
-
16
-
17
-
18
-
19
-
20
-
21
-
22
-
23
-
24
-
25
-
26
-
27
-
28
-
29
-
30
-
31
-
32
-
33
-
34
-
35
-
36
-
37
-
38
-
39
-
40
-
41
-
42
-
43
-
44
-
45
-
46
-
47
-
48
-
49
-
50
-
51
-
52
-
53
-
54
-
55
-
56
-
57
-
58
-
59
-
60
-
61
-
62
-
63
-
64
-
65
-
66
-
67
-
68
-
69
-
70
-
71
-
72
-
73
-
74
-
75
-
76
-
77
-
78
-
79
-
80
-
81
-
82
-
83
-
84
-
85
-
86
-
87
-
88
-
89
-
90
-
91
-
92
-
93
-
94
-
95
-
96
-
97
-
98
-
99
-
100
-
101
-
102
-
103
-
104
-
105
-
106
-
107
-
108
-
109
-
110
-
 111
111 -
 112
112 -
 113
113 -
 114
114 -
 115
115 -
 116
116 -
 117
117 -
 118
118 -
 119
119 -
 120
120 -
 121
121 -
 122
122 -
 123
123 -
 124
124 -
 125
125 -
 126
126 -
 127
127 -
 128
128 -
 129
129 -
 130
130 -
 131
131 -
132
-
133
-
134
-
135
-
136
-
137
-
138
-
139
-
140
 |
 |

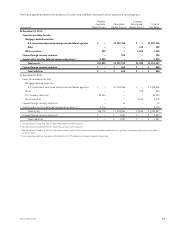
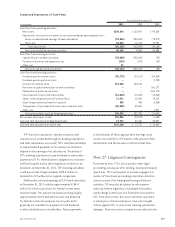
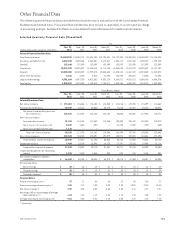
Other Financial Data
The selected quarterly financial data presented below should be read in conjunction with the Consolidated Financial
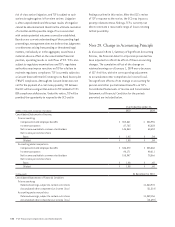
Statements and related notes. Prior period financial data has been revised, as applicable, for a retrospective change
in accounting principle. See Note 28 of Notes to Consolidated Financial Statements for additional information.
Selected Quarterly Financial Data (Unaudited)
At
(Dollars in thousands, except per-share data)
Dec. 31,
2011
Sept. 30,
2011
June 30,
2011
March 31,
2011
Dec. 31,
2010
Sept. 30,
2010
June 30,
2010
March 31,
2010
Selected Financial Condition Data:
Total loans and leases $14,150,255 $14,339,715 $14,631,945 $14,796,541 $14,788,304 $14,896,601 $14,639,893 $14,706,423
Securities available for sale 2,324,038 2,600,806 2,463,367 2,172,017 1,931,174 1,947,462 1,940,331 1,899,825
Goodwill 225,640 152,599 152,599 152,599 152,599 152,599 152,599 152,599
Total assets 18,979,388 19,092,027 18,834,416 18,712,136 18,465,025 18,312,978 18,029,622 18,187,102
Deposits 12,202,004 12,320,502 11,939,476 12,043,684 11,585,115 11,461,519 11,523,043 11,882,373
Short-term borrowings 6,416 7,204 9,514 12,898 126,790 344,681 14,805 17,590
Long-term borrowings 4,381,664 4,397,750 4,415,362 4,533,176 4,858,821 4,581,511 4,600,820 4,496,574
Total equity 1,878,627 1,872,044 1,769,619 1,724,471 1,480,163 1,505,327 1,474,113 1,393,405
Three Months Ended
Dec. 31,
2011
Sept. 30,
2011
June 30,
2011
March 31,
2011
Dec. 31,
2010
Sept. 30,
2010
June 30,
2010
March 31,
2010
Selected Operations Data:
Net interest income $ 173,434 $ 176,064 $ 176,150 $ 174,040 $ 174,286 $ 173,755 $ 176,499 $ 174,662
Provision for credit losses 59,249 52,315 44,005 45,274 77,646 59,287 49,013 50,491
Net interest income after provision
for credit losses 114,185 123,749 132,145 128,766 96,640 114,468 127,486 124,171
Non-interest income:
Fees and other revenue 91,315 116,108 114,369 114,246 120,309 129,437 136,043 123,073
Gains (losses) on securities, net 5,842 1,648 (227) – 21,185 8,505 (137) (430)
Gains on auto loans held for sale 1,133 – – – – – – –
Total non-interest income 98,290 117,756 114,142 114,246 141,494 137,942 135,906 122,643
Non-interest expense 187,533 188,848 195,091 192,979 185,972 190,908 188,361 191,094
Income before income tax expense 24,942 52,657 51,196 50,033 52,162 61,502 75,031 55,720
Income tax expense 7,424 19,159 19,086 18,772 17,391 23,226 28,438 21,116
Income after income tax expense 17,518 33,498 32,110 31,261 34,771 38,276 46,593 34,604
Income attributable to non-controlling
interest 1,075 1,243 1,686 989 898 912 1,186 301
Net income available to common
stockholders $ 16,443 $ 32,255 $ 30,424 $ 30,272 $ 33,873 $ 37,364 $ 45,407 $ 34,303
Per common share:
Basic earnings $ .10 $ .20 $ .19 $ .21 $ .24 $ .26 $ .32 $ .26
Diluted earnings $ .10 $ .20 $ .19 $ .21 $ .24 $ .26 $ .32 $ .26
Dividends declared $ .05 $ .05 $ .05 $ .05 $ .05 $ .05 $ .05 $ .05
Financial Ratios:
Return on average assets (1) .37 .71 .68 .68 .75 .85 1.03 .77
Return on average common equity (1) 3.55 7.12 7.00 8.00 9.09 10.08 12.82 10.80
Net interest margin (1) 3.92 3.96 4.02 4.06 4.05 4.14 4.19 4.21
Net charge-offs as a percentage of average
loans and leases (1) 1.63 1.48 1.19 1.51 1.75 1.58 1.30 1.22
Average total equity to average assets 9.81 9.58 9.32 8.24 8.05 8.28 7.88 7.10
(1) Annualized.
1032011 Form 10-K