TCF Bank 2011 Annual Report Download - page 11
Download and view the complete annual report
Please find page 11 of the 2011 TCF Bank annual report below. You can navigate through the pages in the report by either clicking on the pages listed below, or by using the keyword search tool below to find specific information within the annual report.-
 1
1 -
 2
2 -
 3
3 -
 4
4 -
 5
5 -
 6
6 -
 7
7 -
 8
8 -
 9
9 -
 10
10 -
 11
11 -
 12
12 -
 13
13 -
 14
14 -
 15
15 -
 16
16 -
 17
17 -
 18
18 -
 19
19 -
 20
20 -
 21
21 -
 22
22 -
23
-
24
-
25
-
26
-
27
-
28
-
29
-
30
-
31
-
32
-
33
-
34
-
35
-
36
-
37
-
38
-
39
-
40
-
41
-
42
-
43
-
44
-
45
-
46
-
47
-
48
-
49
-
50
-
51
-
52
-
53
-
54
-
55
-
56
-
57
-
58
-
59
-
60
-
61
-
62
-
63
-
64
-
65
-
66
-
67
-
68
-
69
-
70
-
71
-
72
-
73
-
74
-
75
-
76
-
77
-
78
-
79
-
80
-
81
-
82
-
83
-
84
-
85
-
86
-
87
-
88
-
89
-
90
-
91
-
92
-
93
-
94
-
95
-
96
-
97
-
98
-
99
-
100
-
101
-
102
-
103
-
104
-
105
-
106
-
107
-
108
-
109
-
110
-
111
-
112
-
113
-
114
-
115
-
116
-
117
-
118
-
119
-
120
-
121
-
122
-
123
-
124
-
125
-
126
-
127
-
128
-
129
-
130
-
131
-
132
-
133
-
134
-
135
-
136
-
137
-
138
-
139
-
140
 |
 |

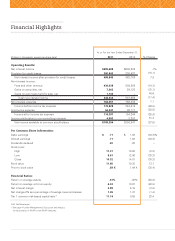
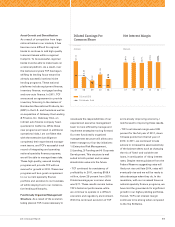
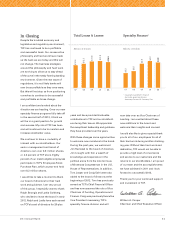
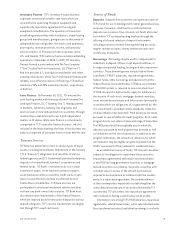
Non-performing assets declined
steadily throughout 2011, down $53.1
million, or 10.9 percent, from 2010 and
have now decreased five consecutive
quarters. This decline in non-performing
assets is primarily due to decreases in
commercial and leasing and equipment
finance non-accrual loans and leases.
Despite the continued economic stress
on unemployment and home values,
we saw some stabilization in consumer
real estate delinquencies. To help our
customers avoid home foreclosure, TCF
has continued its program of providing
loan modifications which are accounted
for as troubled debt restructurings
(TDRs). The TDRs extend payment
dates, reduce interest rates and/or
reduce payment amounts for a term
of up to five years. These TDRs are
underwritten individually. Our goal is
to extend these TDRs to customers who
can make a payment and truly want to
stay in their homes.
At December 31, 2011, TCF held $433.1
million of accruing modified consumer
TDRs, up 28.4 percent from 2010, with
a weighted average interest rate of
3.7 percent. The TDR reserves are
based on the present value of expected
cash flows, or 13.5 percent, with a
fourth quarter annualized net charge-off
rate of 6.5 percent. To date, these TDRs
are performing as expected and have
proven to be an effective way to help
mitigate losses.
TCF’s Wholesale Banking division saw
some credit stabilization throughout
2011. Commercial net charge-offs and
provision tend to be lumpy as credits
are worked out, especially in this
challenging workout environment.
Overall, our specialty finance loans and
leases continue to perform very well.
We continue to closely monitor our
wholesale customers, and in particular,
those customers in distressed indus-
tries and geographies. Our relationship
banking strategy provided us with the
ability to effectively work out many
distressed loans. Wholesale Banking
continues to be a very profitable,
well-managed and highly diversified
segment.
Real estate owned properties decreased
throughout 2011. This was an encour-
aging sign as the length of time in the
foreclosure process continues to be
lengthy. At December 31, 2011, TCF
owned 465 consumer real estate
properties and 33 commercial real
estate properties, compared with
520 and 28 properties, respectively,
at December 31, 2010.
At December 31, 2011, TCF’s allowance
for loan and lease losses totaled $255.7
million, or 1.81 percent of loans and
leases, a decrease of $10.1 million from
December 31, 2010. The decrease in
allowance for loan and lease losses
was primarily due to charge-offs of
commercial loans during the first
quarter of 2011 that had previously been
specifically reserved for. TCF’s provision
for credit losses of $200.8 million
decreased 15.1 percent from last year.
Overall, we saw some good signs of
credit stabilization in 2011, not the least
of which was the consistent decline in
non-performing assets. That being said,
we still experienced elevated levels of
credit losses and delinquencies due to
the persistent economic conditions.
We are encouraged by the trends and
feel we are on the right track, but
ultimate success will only occur when
the economy gets back on track.
072011 Annual Report
1110090807
.65%
Percent
1.29%
1.68%
1.80%
1.81%
Allowance for Loan & Lease Losses
Net Charge-Offs
Net Charge-Offs & Allowance
for Loan & Lease Losses
Percent
1110090807
$106
$234
$402
$486
$433
Non-Performing Assets
Millions of Dollars