TCF Bank 2011 Annual Report Download - page 70
Download and view the complete annual report
Please find page 70 of the 2011 TCF Bank annual report below. You can navigate through the pages in the report by either clicking on the pages listed below, or by using the keyword search tool below to find specific information within the annual report.-
 1
1 -
2
-
3
-
4
-
5
-
6
-
7
-
8
-
9
-
10
-
11
-
12
-
13
-
14
-
15
-
16
-
17
-
18
-
19
-
20
-
21
-
22
-
23
-
24
-
25
-
26
-
27
-
28
-
29
-
30
-
31
-
32
-
33
-
34
-
35
-
36
-
37
-
38
-
39
-
40
-
41
-
42
-
43
-
44
-
45
-
46
-
47
-
48
-
49
-
50
-
51
-
52
-
53
-
54
-
55
-
56
-
57
-
58
-
59
-
 60
60 -
 61
61 -
 62
62 -
 63
63 -
 64
64 -
 65
65 -
 66
66 -
 67
67 -
 68
68 -
 69
69 -
 70
70 -
 71
71 -
 72
72 -
 73
73 -
 74
74 -
 75
75 -
 76
76 -
 77
77 -
 78
78 -
 79
79 -
 80
80 -
81
-
82
-
83
-
84
-
85
-
86
-
87
-
88
-
89
-
90
-
91
-
92
-
93
-
94
-
95
-
96
-
97
-
98
-
99
-
100
-
101
-
102
-
103
-
104
-
105
-
106
-
107
-
108
-
109
-
110
-
111
-
112
-
113
-
114
-
115
-
116
-
117
-
118
-
119
-
120
-
121
-
122
-
123
-
124
-
125
-
126
-
127
-
128
-
129
-
130
-
131
-
132
-
133
-
134
-
135
-
136
-
137
-
138
-
139
-
140
 |
 |
Interest-Rate Risk
Interest-rate risk is defined as the exposure of net interest
income and fair value of financial instruments (interest-
earning assets, deposits and borrowings) to adverse
movements in interest rates. TCF’s results of operations
are dependent to a large degree on its net interest income
and its ability to manage interest-rate risk. As such, the
Company considers interest-rate risk to be one of its
most significant market risks. ALCO meets regularly and
is responsible for reviewing the Company’s interest-rate
sensitivity position and establishing policies to monitor and
limit exposure to interest-rate risk. The principal objective
of TCF’s asset/liability management activities is to provide
maximum levels of net interest income while maintaining
acceptable levels of interest-rate risk and liquidity risk and
facilitating the funding needs of the Company.
Interest-rate risk arises mainly from the structure
of the balance sheet. Since TCF does not hold a trading
portfolio, the Company is not exposed to market risk
from trading activities. As such, the major sources of the
Company’s interest-rate risk are timing differences in
the maturity and repricing characteristics of assets and
liabilities, changes in the shape of the yield curve, changes
in customer behavior and changes in relationships between
rate indices (basis risk). Management measures these risks
and their impact in various ways, including through the
use of simulation and valuation analyses. The interest rate
scenarios may include gradual or rapid changes in interest
rates, spread narrowing and widening, yield curve twists
and changes in assumptions about customer behavior in
various interest rate scenarios.
TCF utilizes net interest income simulation models to
estimate the near-term effects (next one to two years)
of changing interest rates on its net interest income.
Net interest income simulation involves forecasting net
interest income under a variety of scenarios, including
through variation of interest rate levels, the shape of
the yield curve and the spreads between market interest
rates. Management exercises its best judgment in making
assumptions regarding both events that management can
influence, such as non-contractual deposit repricings,
and events outside of its control, such as customer
behavior on loan and deposit activity, and the effect that
competition has on both loan and deposit pricing. These
assumptions are inherently uncertain and, as a result, net
interest income simulation results will likely differ from
actual results due to the timing, magnitude and frequency
of interest rate changes, changes in market conditions,
customer behavior and management strategies, among
other factors.
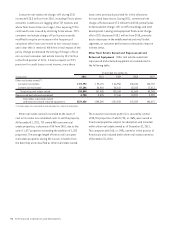
At December 31, 2011, net interest income is estimated to
increase by 2% compared with the base case scenario over
the next 12 months if short- and long-term interest rates
were to sustain an immediate increase of 100 basis points.
Management also uses valuation analyses to measure
risk in the balance sheet that might not be taken into
account in the net interest income simulation analyses.
Net interest income simulation highlights exposure over
a relatively short time period (12 or 24 months), while
valuation analysis incorporates all cash flows over the
estimated remaining life of all balance sheet positions.
The valuation of the balance sheet, at a point in time,
is defined as the discounted present value of asset cash
flows minus the discounted value of liability cash flows.
Valuation analysis addresses only the current balance
sheet and does not incorporate the growth assumptions
that are used in the net interest income simulation model.
As with the net interest income simulation model, valuation
analysis is based on key assumptions about the timing and
variability of balance sheet cash flows and does not take
into account any potential responses by management to
anticipated changes in interest rates.
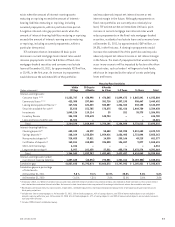
Additionally, management utilizes an interest-rate
gap measurement, which is calculated by taking the
difference between interest-earning assets and interest-
bearing liabilities repricing within a given period. While
the interest-rate gap measurement has some limitations,
including a lack of assumptions regarding future asset or
liability production and a static interest rate assumption,
it represents the net asset or liability sensitivity at a
point in time. An interest-rate gap measurement could
be significantly affected by external factors such as loan
prepayments, early withdrawals of deposits, changes in
the correlation of various interest-bearing instruments,
competition or a rise or decline in interest rates.
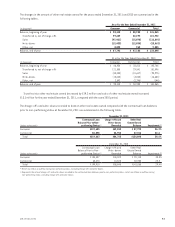
TCF’s one-year interest-rate gap was a positive $2.1
billion, or 10.9% of total assets, at December 31, 2011,
compared with a positive $515.5 million, or 2.8% of total
assets at December 31, 2010. The change in the gap
from 2010 is primarily due to decreased levels of fixed-
rate loans, an increase in non-contractual deposits and
increased equity. A positive interest-rate gap position
52 TCF Financial Corporation and Subsidiaries