TCF Bank 2011 Annual Report Download - page 59
Download and view the complete annual report
Please find page 59 of the 2011 TCF Bank annual report below. You can navigate through the pages in the report by either clicking on the pages listed below, or by using the keyword search tool below to find specific information within the annual report.-
 1
1 -
2
-
3
-
4
-
5
-
6
-
7
-
8
-
9
-
10
-
11
-
12
-
13
-
14
-
15
-
16
-
17
-
18
-
19
-
20
-
21
-
22
-
23
-
24
-
25
-
26
-
27
-
28
-
29
-
30
-
31
-
32
-
33
-
34
-
35
-
36
-
37
-
38
-
39
-
40
-
41
-
42
-
43
-
44
-
45
-
46
-
47
-
48
-
 49
49 -
 50
50 -
 51
51 -
 52
52 -
 53
53 -
 54
54 -
 55
55 -
 56
56 -
 57
57 -
 58
58 -
 59
59 -
 60
60 -
 61
61 -
 62
62 -
 63
63 -
 64
64 -
 65
65 -
 66
66 -
 67
67 -
 68
68 -
 69
69 -
70
-
71
-
72
-
73
-
74
-
75
-
76
-
77
-
78
-
79
-
80
-
81
-
82
-
83
-
84
-
85
-
86
-
87
-
88
-
89
-
90
-
91
-
92
-
93
-
94
-
95
-
96
-
97
-
98
-
99
-
100
-
101
-
102
-
103
-
104
-
105
-
106
-
107
-
108
-
109
-
110
-
111
-
112
-
113
-
114
-
115
-
116
-
117
-
118
-
119
-
120
-
121
-
122
-
123
-
124
-
125
-
126
-
127
-
128
-
129
-
130
-
131
-
132
-
133
-
134
-
135
-
136
-
137
-
138
-
139
-
140
 |
 |

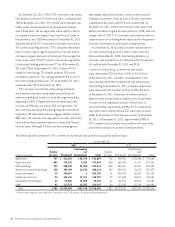
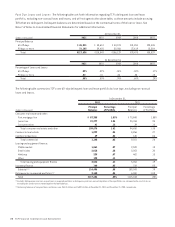
The increase in the consumer real estate allowance was
primarily due to increases in the provision for credit losses
as a result of increased levels of TDRs. The increased level
of allowance on TDRs was primarily due to growth in TDRs,
in part due to a new required accounting standard, and
use of longer term modifications. The adoption of
this standard during the third quarter of 2011 increased
accruing consumer real estate TDRs by $20.7 million,
and reserves on impaired consumer real estate loans by
$2.2 million, related to loans that were modified in 2011,
but were not TDRs under standards in place at that time.
The level of commercial lending allowances is generally
volatile due to reserves for specific loans based on
individual facts and collateral values as loans migrate to
classified commercial loans or to non-accrual. Charge-offs
are taken against such specific reserves. The decrease in
the allowance for commercial lending in 2011 was primarily
due to charge-offs of commercial loans that had previously
been specifically reserved. The leasing and equipment
finance allowance decreased $5.1 million compared to
2010 primarily due to improved customer performance in
the middle market and small ticket segments.
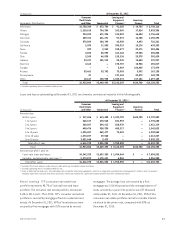
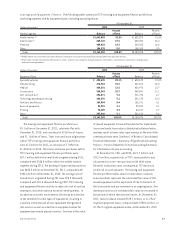
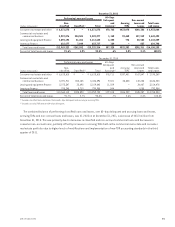
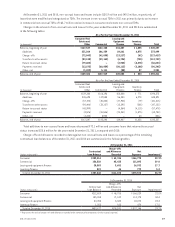
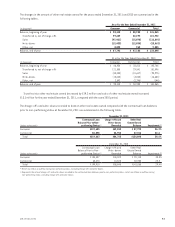
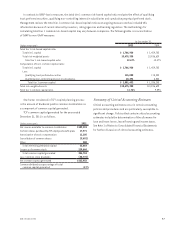
The following tables set forth information detailing the allowance for loan and lease losses.
Year Ended December 31,
(Dollars in thousands) 2011 2010 2009 2008 2007
Balance, at beginning of year $ 265,819 $ 244,471 $ 172,442 $ 80,942 $ 58,543
Charge-offs:
Consumer real estate:
First mortgage lien (94,724) (78,605) (55,420) (30,262) (9,809)
Junior lien (62,130) (56,125) (53,137) (32,937) (11,977)
Total consumer real estate (156,854) (134,730) (108,557) (63,199) (21,786)
Consumer other (12,680) (16,377) (18,498) (20,830) (19,455)
Total consumer real estate and other (169,534) (151,107) (127,055) (84,029) (41,241)
Commercial real estate (32,890) (45,682) (35,956) (11,884) (2,409)
Commercial business (9,843) (4,045) (9,810) (5,731) (1,264)
Total commercial (42,733) (49,727) (45,766) (17,615) (3,673)
Leasing and equipment finance (16,984) (34,745) (29,372) (13,156) (7,507)
Inventory finance (1,044) (1,484) (205) – –
Total charge-offs (230,295) (237,063) (202,398) (114,800) (52,421)
Recoveries:
Consumer real estate:
First mortgage lien 510 2,237 808 210 260
Junior lien 3,233 2,633 1,129 625 948
Total consumer real estate 3,743 4,870 1,937 835 1,208
Consumer other 9,262 11,338 10,741 11,525 13,019
Total consumer real estate and other 13,005 16,208 12,678 12,360 14,227
Commercial real estate 1,502 724 440 30 –
Commercial business 152 603 697 130 16
Total commercial 1,654 1,327 1,137 160 16
Leasing and equipment finance 4,461 4,100 2,053 1,735 3,585
Inventory finance 193 339 23 – –
Total recoveries 19,313 21,974 15,891 14,255 17,828
Net charge-offs (210,982) (215,089) (186,507) (100,545) (34,593)
Provision charged to operations 200,843 236,437 258,536 192,045 56,992
Other (8) – – – –
Balance, at end of year $ 255,672 $ 265,819 $ 244,471 $ 172,442 $ 80,942
Net charge-offs as a percentage
of average loans and leases 1.45% 1.47% 1.34% .78% .29%
412011 Form 10-K